
Yes, selling on Amazon can be profitable, but profit depends on contribution margin rather than sales, and in Jungle Scout's 2024 State of the Amazon Seller report 57% of surveyed sellers reported net margins above 10%. That direct answer challenges the most popular advice in this space, which is to find a high demand product, launch it, and let volume solve the rest.
Volume doesn't solve weak math. It scales it.
And that's the uncomfortable part. A product that loses a little on every order doesn't get rescued by more orders. It just ties up more cash in inventory, ads, and returns, faster.
So is selling on Amazon profitable for you? Not in general. For a specific SKU, at a specific price, package size, and ad cost. That's the only version of the question worth answering.
Table of Contents
- Is Selling on Amazon Profitable? What the Numbers Really Say
- Contribution Margin, Not Revenue, Decides the Outcome
- Breaking Down Amazon Fees Line by Line
- Variable Costs From COGS to Advertising
- Break-Even and Margin Scenarios With Real Numbers
- Choosing a Business Model That Fits Your Capital
- Strategies to Improve ROI and Take the Next Step
Is Selling on Amazon Profitable? What the Numbers Really Say
Most owners start with revenue. It's the number Seller Central puts in front of you, and it's easy to feel good about. It's also the wrong starting point.
In Jungle Scout's 2024 State of the Amazon Seller report, 57% of surveyed sellers and small to medium sized businesses reported net profit margins above 10%, and 44% reported margins above 15%. The same survey found 52% generated more than $1,000 in monthly sales.
Read those two facts together. Many sellers get meaningful revenue. Fewer turn it into meaningful owner income.
Revenue, Margin, and Income Are Three Different Numbers
Take the simple example from that data. A seller at a 15% margin on $10,000 in monthly sales keeps about $1,500 before owner compensation and certain overhead. At 5%, it's $500. Same storefront. Same effort. Very different business.
Timing matters too, and patience is part of the price. In that report, 58% of sellers reported becoming profitable within their first year, while approximately 22% reached profitability within three months. Those figures show a viable path, not a guarantee.
- Revenue: what buyers pay before Amazon and your suppliers take their share
- Margin: what's left per unit after the costs tied to that sale
- Owner income: what's left after overhead, taxes, and cash stuck in stock
The marketplace itself isn't a side channel. Based on Amazon's 2024 annual report data, third party seller services revenue grew from $53.76 billion in 2019 to approximately $156.1 billion in 2024, and independent reporting based on Amazon disclosures estimates third party sellers represented about 60% of Amazon sales by the third quarter of 2024, compared with roughly 25% in 2005.
That scale explains the opportunity and the pressure. Demand, logistics, and purchasing intent already exist. So do referral fees, fulfillment charges, storage, advertising, and direct price competition.
Averages can also mislead you because surveys of active sellers may exclude merchants who quit after losses. That's survivorship bias, and it can make the whole market look healthier than your next product launch will be.
Don't ask if Amazon works. Ask whether your product keeps enough after every cost layer. Those are different questions – and only the second one protects your cash.
Contribution Margin, Not Revenue, Decides the Outcome
A product can sell steadily and still drain cash. The useful question is what each unit contributes after the costs caused by that sale, before fixed overhead enters the picture. That is contribution margin.
Amazon profitability is a per-SKU calculation. An account-level average can make a losing product look acceptable when stronger listings mask its shortfall.
The Formula to Run Before You Buy Inventory
Calculate contribution per unit:
Contribution margin = selling price – cost of goods – referral fee – fulfillment – storage – advertising – returns
Use costs attributable to the unit sold. Fixed overhead, including software, bookkeeping, and tools, is not a variable cost, so do not subtract it in this formula. The contribution left over must cover those fixed expenses before the business has profit.
Work through the numbers in order:
- Start with the buyer price: use what the customer pays, not an optimistic launch price.
- Subtract landed cost: include manufacturing, inbound freight, and preparation before the unit is saleable.
- Subtract Amazon's variable charges: account for referral fees, fulfillment, and expected storage for that unit.
- Subtract selling costs: include advertising per unit and expected returns or discounts.
- Compare the remainder with overhead: contribution must cover fixed costs before it can become profit.
A gross margin can look healthy before advertising and returns. Add those costs and the unit may contribute much less. That is why the calculation belongs at SKU level, with realistic costs rather than account averages.
Why One Average Margin Is Misleading
The SBE Council's 2025 survey report, the 2025 Small Business Technology Use Survey, reported a typical Amazon seller profit margin of approximately 28.5%. Its distribution also shows meaningful variation: 21% of sellers reported margins below 11%, while 26% reported margins from 11% to 20%. Together, those groups account for 47% of respondents reporting margins at or below 20%. The survey also found that 47% considered their Amazon margins higher than on other channels, while 41% considered them approximately the same. The figures describe different sellers and do not predict the result for any one SKU.
Use the survey as context, not as a forecast. Your outcome depends on your product's costs, pricing, advertising, and return rate. A seller-wide average cannot tell you whether a particular listing will pay its share of overhead.
Test each SKU under conservative, base, and stressed assumptions. In the conservative case, use realistic costs and expected sales. In the stressed case, allow for higher ad spend, more returns, or slower turnover. And check whether the resulting contribution can still cover fixed overhead.
Practical rule: If contribution stays positive under the stressed case, the product may merit further review. If it works only when costs stay low and sales go smoothly, the margin is fragile.
Run that test before committing to inventory, packaging, or a launch calendar. A spreadsheet can expose a weak SKU before it ties up cash in stock.
Breaking Down Amazon Fees Line by Line
Owners usually underestimate fees because they look at one or two charges in isolation. Amazon doesn't charge you in isolation. It charges in layers.
The Selling Plan Is Only the Entry Fee
Amazon's U.S. selling costs begin with the plan. The Individual plan charges $0.99 per item sold, while the Professional plan costs $39.99 per month, and at 41 sales the Individual plan alone would cost $40.59, slightly more than the Professional subscription, based on Amazon's U.S. selling plan and referral fee summary. The same source says most referral fee categories fall between 8% and 15%.
That plan math is simple. The rest isn't.
Referral fees are category dependent, and they're calculated on the buyer's total sales price, including item price plus delivery and gift wrap charges, with Amazon charging whichever is greater, the percentage fee or the applicable minimum fee, as explained in Amazon Seller Central's referral fee reference. On low priced items, or listings where the buyer pays shipping, that base matters more than sellers expect.
FBA Turns Size and Time Into Cost
If you use Fulfillment by Amazon, you add per unit fulfillment charges based on size and weight, plus storage based on volume and time held. Amazon's Revenue Calculator lets you compare FBA with seller fulfillment using price, dimensions, weight, shipping, and cost inputs, as described on Amazon's sell online guidance.
That's where product design becomes a finance decision. A bulky package can raise fulfillment and storage costs even when the product itself is cheap to make. Slow moving stock can accumulate storage or aged inventory charges while your cash sits still.
Core Amazon Fee Layers and What Drives Them
| Fee layer | How it is charged | What moves the cost |
|---|---|---|
| Selling plan | Per item or flat monthly subscription | Your monthly unit volume |
| Referral fee | Percentage of total buyer price, or a minimum fee | Category, price, delivery and gift wrap charges |
| FBA fulfillment | Per unit picked, packed, and shipped | Package size, weight, and dimensional weight |
| Storage and aged inventory | Based on volume and time held | Sell through rate, batch size, seasonality |
| Optional selling costs | Advertising, promotions, disposal, and programs such as Vine | How much paid demand and cleanup the SKU needs |
And those optional layers aren't rare extras. Amazon's 2025 fee explanation identifies multiple cost layers beyond the plan and referral fee, including FBA fulfillment, inventory storage, aged inventory surcharges, disposal, advertising, promotions, and Vine, in Amazon's guide to fees for selling on Amazon.
Before launch, model at least three setups – FBA, merchant fulfillment, and a smaller package configuration. If you need help finding the inputs, practical guidance on how to use Amazon Seller Central can help you locate the reports behind your real charges instead of guessing from a dashboard average.
Reject a product that needs optimistic ad efficiency or rapid turnover just to survive its fee stack. Fees are predictable. Hope isn't a substitute.
Variable Costs From COGS to Advertising
Amazon's fees are visible. Your other variable costs are where margin disappears, often without a single dramatic mistake.
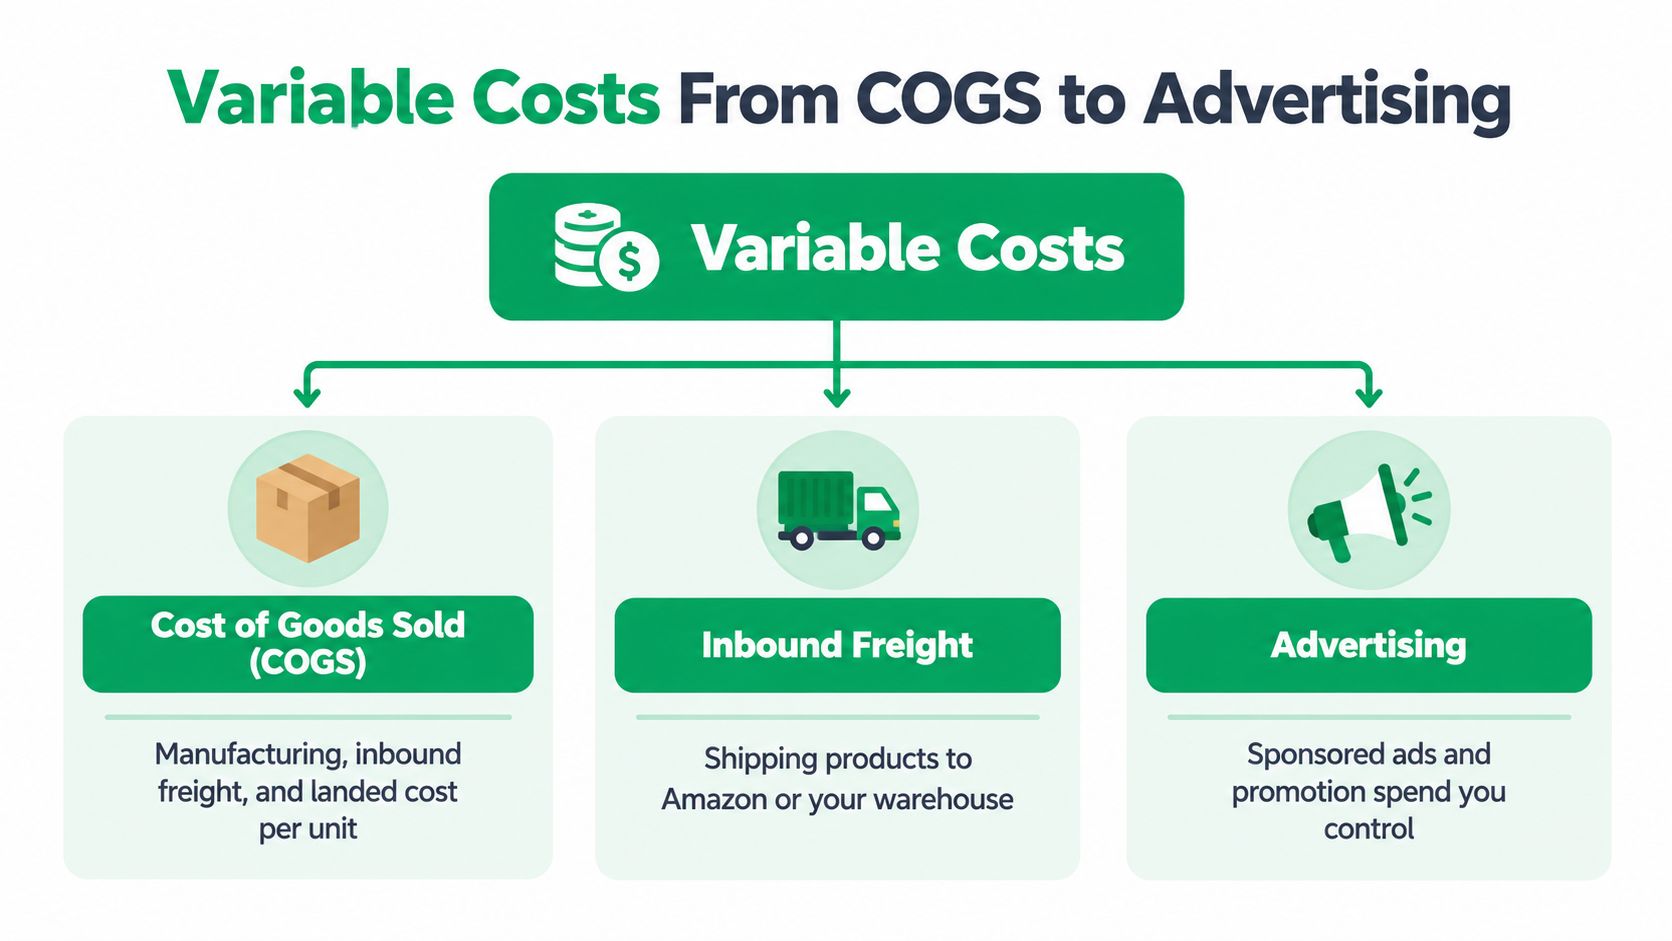
Start with cost of goods sold. That means manufacturing, inbound freight, and landed cost per unit, fully loaded before Amazon touches the product. If you quote factory price and forget freight, prep, or inbound placement to your warehouse or Amazon, your margin is fictional from line one.
Advertising Is a Variable Cost, Not a Growth Badge
Sponsored Products and other Amazon ads can create demand you wouldn't get organically. They can also mask weak unit economics for months, because sales keep arriving while each order contributes less than you think.
Treat ad spend per unit like any other cost of the sale. If a SKU only sells when you buy every click at launch prices that never improve, you don't have a marketing problem. You have a margin problem that advertising is exposing.
Owners who track customer acquisition cost across channels usually spot this faster, because they stop judging ads by attributed sales alone and start judging them by what each new order costs after fees and product cost.
The Quiet Drains Owners Miss
Returns, discounting, and aged inventory don't announce themselves the way an ad invoice does. They chip away.
- Returns: you may lose the sale, pay handling costs, and get back stock you can't resell as new.
- Discounting: coupons and price cuts come straight out of contribution, while some fees still apply to the transaction.
- Aged inventory: unsold units keep incurring storage while tying up cash you need for winners.
- Packaging waste: oversized boxes raise freight, fulfillment, and storage at the same time.
Separate those variable costs from fixed overhead such as software, bookkeeping, and tools. Variable costs rise with each unit. Fixed overhead is spread across units, so it hurts most at low volume.
Find the one cost line that would hurt you most if it moved a little. For many sellers it's advertising per unit or return rate, not the factory quote they negotiated hardest.
That's where your next optimization effort belongs. Not on the cheapest supplier at any cost. On the variable that controls whether selling on Amazon is profitable for that SKU after real selling conditions, not launch week conditions.
And be honest about dependence. If paid ads stop and sales collapse, your true variable cost includes buying demand indefinitely. Price that in.
Break-Even and Margin Scenarios With Real Numbers
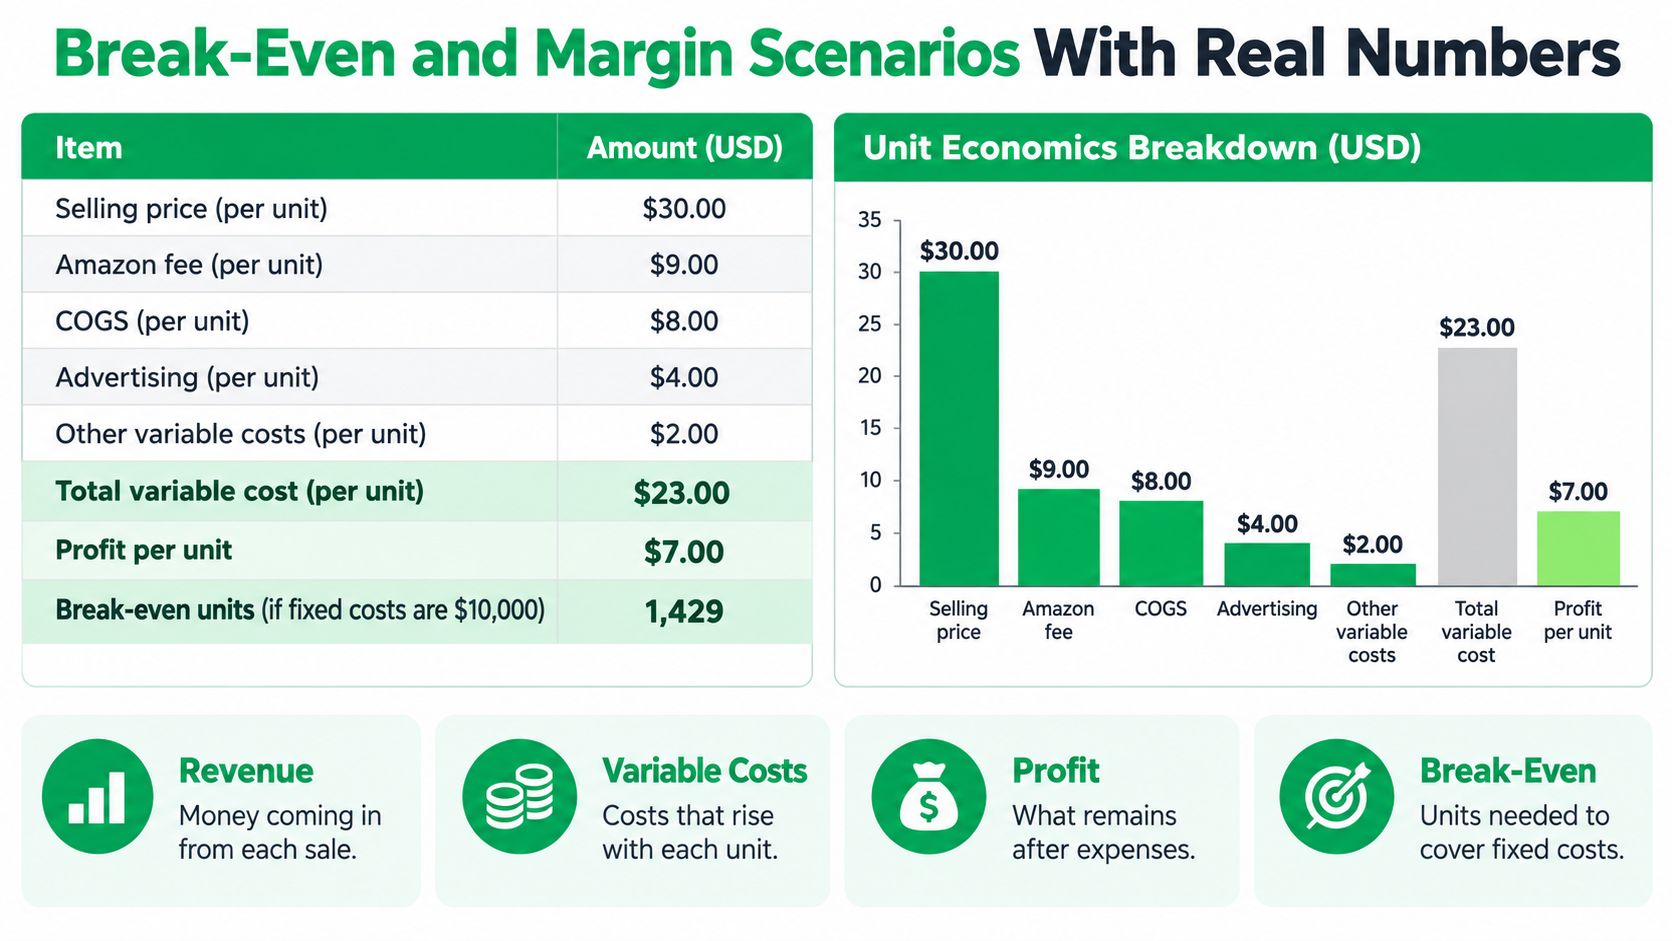
A SKU can look profitable at its target price and still fail once costs move against it. Model the same product under conservative, base, and stressed assumptions. The decision rests on cash contribution per unit, not on sales volume alone.
Small Per Unit Changes Compound Fast
Amazon's announced 2026 U.S. fee changes raise FBA fees by an average of $0.08 per unit sold, or less than 0.5% of an average item's selling price. Most changes took effect January 15, 2026. For products priced from $10 to $50, the notice lists average increases of $0.25 for small standard-size products and $0.05 for large standard-size products (Amazon Seller Central's 2026 fee change notice). At 10,000 units, an extra $0.25 per unit reduces gross contribution by $2,500, before other expenses.
That can leave less cash for a reorder, even when the original forecast showed a profit.
Work the Example, Then Stress It
Use the infographic's structure as a template, but replace its inputs with your own supplier quote, package dimensions, and fee estimate. The calculation is straightforward:
- Set the selling price: use a price buyers already pay for comparable offers, not one your spreadsheet needs.
- List every variable cost per unit: landed cost, referral, fulfillment, storage, advertising, and expected returns.
- Calculate contribution per unit: subtract total variable costs from the selling price.
- Divide assigned fixed costs by contribution: the result is the units needed to cover launch and overhead costs allocated to the SKU.
Check the referral fee base, too. At a 15% rate, a $20 item with $5 in delivery charges generates a $3.75 fee, not $3.00, because the fee applies to $25.
Then test downside assumptions: increase advertising cost per unit, allow for more returns, and slow sell-through so storage lasts longer. Record how much contribution remains in each case. The stressed case shows whether the SKU can absorb ordinary operating pressure or depends on every assumption holding.
Owners measuring marketing ROI should use the same discipline. Count the full cost of generating and fulfilling each sale, rather than treating attributed ad revenue as profit.
If a product only works in the base case, it doesn't work. Real launches reach the stressed case more often than owners plan for.
Set a break-even unit count before launch, then choose a response if sales miss it: reprice, resize the package, reduce ad targets, or exit the SKU. A model is useful only if it leads to a decision while there is still cash and time to act.
Choosing a Business Model That Fits Your Capital
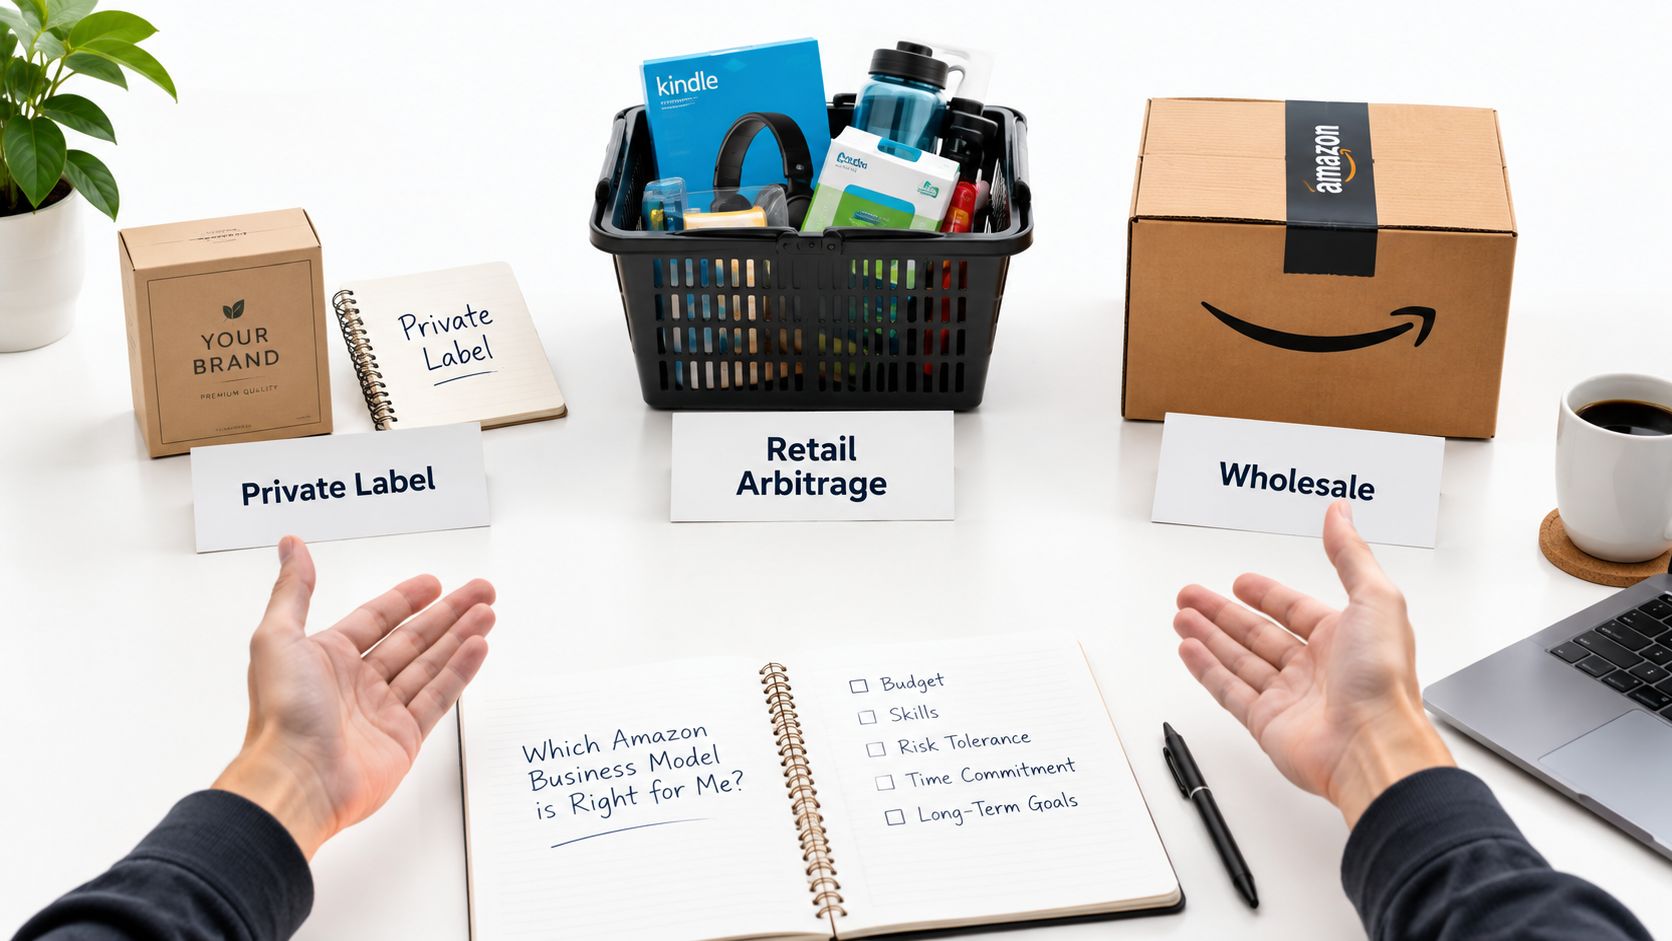
Selling on Amazon isn't one activity. Private label, wholesale, and retail arbitrage use the same marketplace and produce very different economics, risk, and workload.
Picking the wrong model for your capital is a common way to lose money on products that look in demand.
Three Models, Three Cash Profiles
Private label gives you the highest margin ceiling and the most brand control. You control the listing, packaging, and positioning. You also fund product development, larger inventory orders, and sustained advertising before you know if the market agrees with you. The inventory cash conversion cycle is longest here, and a single weak ASIN can trap a lot of capital.
Wholesale sits in the middle. You buy established products from brands or distributors, often with more predictable demand and lower product development risk. Margins are usually thinner, you have less control over the listing and price, and other sellers may share the same offer. Minimum order quantities and supplier terms still decide how much cash you need.
Retail arbitrage needs the least upfront capital and can move quickly. You source discounted products and resell them. Supply is inconsistent, margins vary by find, and scaling means more hunting, not a repeatable supply chain. Fast to start. Hard to build on.
Cost pressure cuts across all three. In Jungle Scout's 2025 Amazon seller report, based on a survey of nearly 1,500 sellers and businesses, more than one third of brands were worried about rising costs, including shipping, goods, and advertising.
That's why the right question is specific. Which model is viable for your company, at your available capital and operating maturity, right now?
Test each candidate against:
- Landed gross margin: enough room after product and freight before Amazon fees
- Minimum viable order quantity: what you must buy before you learn anything
- Cash conversion cycle: how long money stays locked in inventory
- Dependence on one ASIN: what happens if that listing stalls
- Ad dependence: whether sales exist without constant paid support
Researching an Amazon competitor analysis before you commit helps you see whether rivals win on brand, price, reviews, or assortment, and whether your chosen model gives you any of those advantages.
A business that relies on a single ASIN, borrowed inventory capital, or permanently rising ad spend can grow revenue while weakening cash flow. Model fit prevents that trap more reliably than product hype does.
Strategies to Improve ROI and Take the Next Step
Amazon profitability improves one SKU at a time. Once a product survives conservative, base, and stressed assumptions, focus on the operating decisions that increase its contribution per unit. Revenue growth alone can hide a weaker result.
Levers That Move the Number
Start with packaging. Smaller dimensions or a more compact configuration may reduce fulfillment, freight, and storage costs at once. One product change can affect several cost lines.
Review reorder sizes next. Smaller, more frequent orders can limit storage costs and aged inventory exposure, but they may raise inbound costs or increase stockout risk. Match inventory to demonstrated sell-through, not an arbitrary goal of keeping stock low.
Price from contribution. Set the minimum price that leaves an acceptable return after product and marketplace costs. For advertising, compare campaign spend with contribution, not attributed sales alone. The goal is profitable orders, not a larger sales figure.
Cut SKUs that remain unprofitable under stressed assumptions, then direct inventory cash and ad spend toward products with stronger unit economics. Reduce dependence on any one ASIN by adding complementary products or sales channels when the numbers support it.
A structured Amazon advertising campaign can help control bids, search terms, and campaign structure. Review attributed sales alongside total sales. That comparison shows how much the SKU depends on advertising, and whether the spend is supporting profitable orders or buying sales at a loss.
And consider channels beyond Amazon. An own site, wholesale accounts, or retail relationships can spread fixed costs and reduce dependence on one marketplace, provided each channel adds contribution rather than complexity without a return.
Mr. Green Marketing, LLC works with Amazon sellers on listing optimization, PPC management, and Seller Central management. Its engagements begin with a free audit and performance report to identify visibility gaps and prioritize potential improvements. Treat the audit as a starting point: the decision still depends on per-SKU economics.
Do this this week: Build a contribution model for your top three products. Run conservative, base, and stressed cases, using actual package dimensions and ad spend per unit rather than account averages.
This exercise gives a clearer answer than an average margin headline. It separates winners from marginal SKUs and products that lose money after costs. Then act on the result, even when it means delaying a reorder.
If the model shows thin or negative contribution, hold off on buying more inventory until you address price, packaging, or ad efficiency. For a second review, Mr. Green Marketing, LLC offers a free Amazon audit and performance report covering listings, PPC, and Seller Central management. Request an audit to identify margin leakage by SKU and receive a prioritized plan before your next reorder.
Leave a Comment
sing in to post your comment or sign-up if you dont have any account.