
Customer Acquisition Cost: You can be staring at a dashboard that says the campaign is “working” while the bank balance says something else. The ads brought in customers, the agency sent a neat report, and the new orders looked promising, until refunds, creative spend, software, payroll, and overhead got folded back in. That’s where customer acquisition cost stops being a vanity metric and starts acting like a decision tool.
The awkward part is that CAC can look fine in isolation and still sink the business. A single blended number doesn’t tell you whether growth is compounding, whether payback is too slow, or whether one channel is carrying the whole load. And once acquisition costs rise across the market, you can’t fix the problem by buying more traffic and hoping the spreadsheet forgives you.
Customer Acquisition Cost: Table of Contents
- Why Your Customer Acquisition Cost Deserves a Second Look
- Calculating Customer Acquisition Cost the Right Way
- CAC Benchmarks That Actually Mean Something
- Running a Customer Acquisition Cost Audit
- What Each Acquisition Channel Actually Costs
- Tactics That Actually Lower Customer Acquisition Cost
- Tools and Templates for Tracking CAC Over Time
- Quick Answers on Customer Acquisition Cost
Why Your Customer Acquisition Cost Deserves a Second Look
A founder I worked with thought their paid search campaign was profitable. The ads looked efficient, the lead volume was healthy, and the platform dashboard was doing its usual victory lap. Then we loaded in the agency retainer, the creative contractor, the sales salaries, and the refunds from the first month’s orders, and the whole thing stopped looking like growth. It looked like leakage.
That’s the problem with treating customer acquisition cost as a monthly report instead of a business lens. The number by itself doesn’t tell you whether a customer pays back fast enough, whether margin can absorb the spend, or whether one channel is subsidizing another. CAC only becomes useful when it answers a harder question, “Should we keep buying customers this way?”
Customer Acquisition Cost: A metric that hides as much as it reveals
The market has made that question harder to dodge. Industry summaries referenced in ProfitWell-based research say CAC has increased by 60% over the past five years, and a broader app acquisition benchmark cited in the same research says CAC surged 222% over the last 10 years, rising from $19 to $29 per user in one benchmark set. That doesn’t mean every business sees those exact numbers, but it does explain why the old playbook of “just spend more” keeps breaking down, customer acquisition cost trend data.
Practical rule: if you can’t explain payback, margin, and channel mix in the same sentence as CAC, the metric isn’t ready for decision-making.
The useful mindset shift is simple. CAC is not a scorecard, it’s a filter. It tells you whether the business can afford the way it’s growing, and whether the next dollar should go into more traffic, better conversion, better retention, or a different channel altogether.
Calculating Customer Acquisition Cost the Right Way
The textbook formula is clean. The world version is messier, and that mess is where most undercounting happens. A correct customer acquisition cost calculation uses a fully loaded numerator, which means every cost tied to winning the customer has to be included before you divide by new customers acquired.
What belongs in the numerator
Use acquisition-period costs only, then keep them in buckets:
- Ad spend across paid channels
- Salaries and commissions tied to sales or marketing work
- Software and tools used to acquire customers
- Creative production like design, copy, and video
- Agency retainers or contractor fees
- Allocated overhead connected to acquisition work
That fuller approach matters because excluding indirect costs understates CAC and makes channel comparisons look better than they are, a point emphasized in the glossary-style CAC definition from CDP’s customer acquisition cost guide, fully loaded CAC definition. If payroll, software, or overhead help acquisition happen, they’re part of the cost.
Practical rule: if finance would recognize the expense and marketing used it to win customers, it belongs in the numerator.
Customer Acquisition Cost: A worked SMB example
Say an SMB spends $48,000 in a quarter on acquisition and closes 120 new customers in that same quarter. The blended CAC is $400 per customer. That’s a useful starting point, but it’s not the full story.
Now split the same quarter by channel. If paid search costs more per customer than email, referral, or organic search, the blended figure hides where the drag is coming from. That’s why practitioners track blended CAC and channel-level CAC separately, because one number tells you the business-wide average and the other tells you where to fix the machine, channel-level CAC guidance.
The cleanest way to build the model is to work backwards from customers acquired, then sanity-check every cost bucket against bank, payroll, and platform records. If the numerator feels too small, it usually is.
A worked SMB example
In a quarter, the acquisition stack might include search ads, a part-time media buyer, one designer, a CRM subscription, and a slice of leadership time spent on campaign reviews. If a finance review can’t trace those costs cleanly, the CAC number isn’t defensible yet. That’s when a tool like how to calculate marketing ROI becomes useful, because CAC and ROI need the same cost discipline.
Customer Acquisition Cost: CAC Benchmarks That Actually Mean Something
Benchmarks are useful only when they match the business model. A good CAC for a low-friction ecommerce brand can be a disaster for a sales-heavy financial services offer, and the reverse can be true if retention and margin are strong. That’s why generic averages rarely help much.
Compare the business model, not just the number
One benchmark compilation reports B2B SaaS at about $702 per customer, ecommerce DTC at about $45, and financial services at about $1,275, industry CAC benchmarks. Those gaps make sense when you think about trust, compliance, and the length of the buying process. A company with a longer sales cycle or heavier verification burden usually has more friction to absorb before it gets paid.
The more useful lens for recurring-revenue businesses is the New CAC Ratio, which measures how much a company spends to acquire $1 of new ARR. In 2024, the median ratio rose 14% to $2.00, meaning the median SaaS company spent $2 to acquire $1 of new ARR. Fourth-quartile companies were at $2.82 per $1 of new ARR, and the same benchmark set says the typical B2B SaaS company spends $702 to acquire each new customer, SaaS CAC benchmark data.
Practical rule: if first-year revenue can’t cover acquisition and payback, the CAC is only “good” if expansion revenue or retention makes the economics work later.
The old 3:1 LTV-to-CAC idea is still a useful sanity check, but it’s not a strategy by itself. It tells you whether the ratio is in the right zone, not whether the payback window is tolerable or the channel mix is healthy. That’s why I use it as a guardrail, not a finish line.
CAC Ranges by Business Model
| Business Model | Reported CAC | Why It Varies |
|---|---|---|
| B2B SaaS | About $702 per customer | Longer sales cycles, heavier handoff between marketing and sales |
| Ecommerce DTC | About $45 per customer | Lower friction, faster checkout, often higher volume |
| Financial services | About $1,275 per customer | Trust building, compliance, and longer decision cycles |
The point of the table isn’t to crown a winner. It’s to stop people from using the wrong peer group. A DTC brand comparing itself to financial services is wasting time, and a SaaS team comparing itself to a commodity ecommerce store is likely underestimating what it costs to win and keep attention.
Running a Customer Acquisition Cost Audit
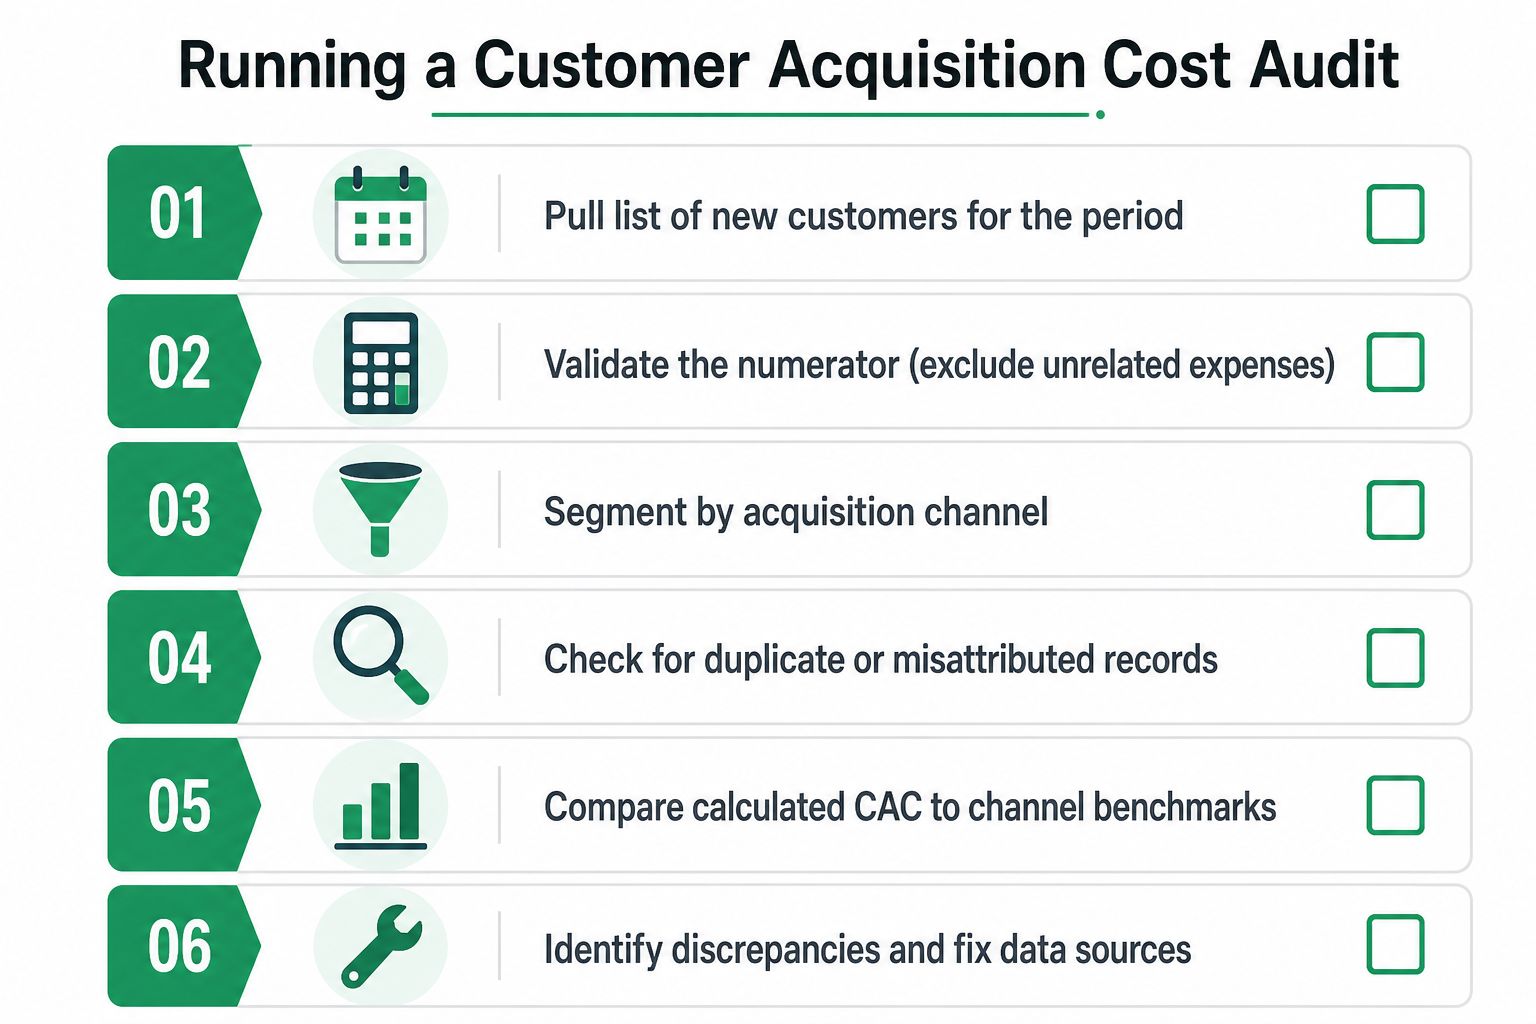
A CAC audit is mostly a data hygiene exercise with business consequences. If the customer list is dirty, the cost buckets are incomplete, or attribution is overstated, the final number may look precise and still be wrong. A defensible audit is the one that survives a CFO question without needing a rescue mission.
Start with the customer denominator
Pull every new customer for one period only, monthly or quarterly, and remove repeats. That sounds basic, but repeat buyers slip into reports all the time, especially when ecommerce platforms and CRMs aren’t aligned. Zendesk’s CAC guidance also stresses that CAC should be calculated from total acquisition costs divided by new customers over the same period, and that the number helps teams identify funnel inefficiencies, CAC calculation guidance.
Then validate the numerator against bank statements, payroll, software invoices, agency bills, and any contractor payments tied to acquisition. If a spend line helped you win a customer, it belongs in the model. If it didn’t, leave it out.
Customer Acquisition Cost: Separate the blended number from channel reality
Once the blended CAC is stable, break it by channel. Paid search, paid social, organic search, email, referrals, marketplaces, and offline touches should each have their own view where possible. That matters in privacy-constrained environments, where last-click attribution can miss the path to purchase and force teams to make false cuts.
The other thing to check is overlap. A customer may click an ad, read a review, and convert later through direct traffic. If the platform credits one touch and finance counts the cost of three touches, your CAC model needs a ruleset, not more optimism. First-party data and broader measurement help more than raw platform reports, a point echoed in current CAC commentary about omnichannel measurement.
Use a quick verification cue
A CAC audit is ready to act on when three things are true. The customer count matches your source of truth, the cost numerator matches the general ledger, and the channel splits explain what the blended number can’t. If any of those are off, fix the data before you chase efficiency.
For teams that want a structured review, digital marketing audit services can help surface attribution gaps, missing cost buckets, and channel mix problems before the next budget cycle starts.
What Each Acquisition Channel Actually Costs
Channel-level CAC changes budget conversations fast. The cheapest channel on paper is not always the one that can scale, and the largest channel is not always the one that deserves more money. When operators mix those two ideas up, they end up funding volume instead of profitability.
Compare the channels side by side
A 2025 search-ad benchmark based on more than 16,000 U.S. campaigns reported average Google Search CPA at $70.11 across industries. The same benchmark set reports Facebook at $18.68, Microsoft Ads at $41.44, and Apple Search Ads at $2.58, CPA benchmark data. Those numbers are channel-specific, not company-wide CAC, but they’re useful for setting expectations.
| Channel | Reported Cost | What it signals |
|---|---|---|
| Google Search | $70.11 CPA | High-intent traffic, usually more expensive |
| $18.68 CPA | Often cheaper reach, quality depends on offer and creative | |
| Microsoft Ads | $41.44 CPA | Mid-range intent and scale in some markets |
| Apple Search Ads | $2.58 CPA | Extremely efficient in the benchmark, but narrow in reach |
The trap is treating the lowest number as the winner. A channel can be cheap and still stall when you push spend, or it can be expensive and still print cash if downstream repeat rate is strong. I’ve seen teams cut a pricey channel too early, only to learn it was feeding their highest-LTV customers.
Make the allocation decision with payback in mind
Use channel CAC to decide where to test next dollars, not where to worship the cheapest traffic. If a channel is below payback target and converting with acceptable quality, it deserves more budget. If it’s above target and there’s no evidence of stronger retention or margin downstream, it needs a rebuild or a pause.
That’s also where a paid-media review from how much does it cost to advertise can be useful, because ad prices only matter when they’re tied to what a customer is worth after the sale.
Tactics That Actually Lower Customer Acquisition Cost
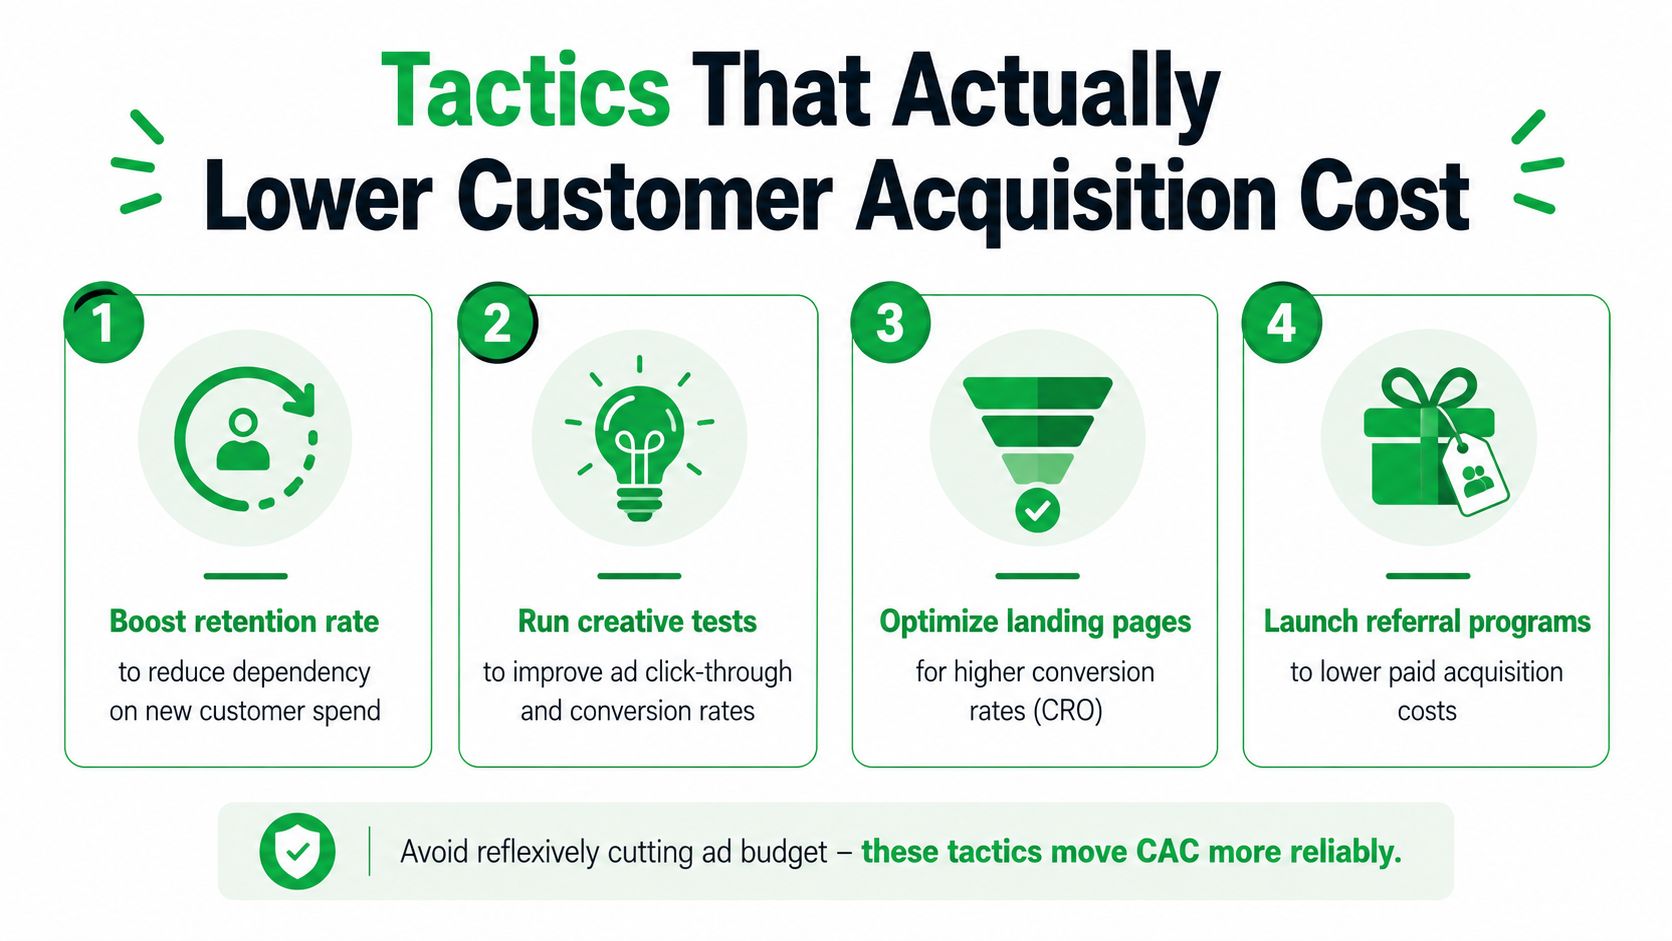
The fastest way to improve CAC is not always to cut spend. The smarter move is to make each dollar work harder by improving retention, conversion, and the amount of trust your acquisition channels have to buy. That’s especially true when media prices are rising and the funnel is already leaky.
Fix the parts that move the denominator
Retention matters because it changes how much pressure you put on new-customer acquisition. When repeat purchase behavior improves, the same acquisition spend supports more revenue, which makes the CAC easier to absorb. That’s why I rarely start with bid tweaks when a business is already under margin pressure.
Creative testing is another lever that gets ignored too often. Stronger hooks, better offer framing, and tighter message match can improve ad-to-landing-page continuity without forcing you to bet on cheaper clicks. If the creative is weak, lowering bids just buys more weak traffic.
Practical rule: if the landing page or offer is underperforming, bid cuts just hide the problem longer.
Prioritize CRO, then referrals, then channel tuning
Conversion-rate optimization often gives the cleanest CAC lift because it increases the number of customers you get from the same traffic. The point isn’t just speed, it’s reducing friction at the exact moment a buyer is ready to decide. For a practical CRO workflow, conversion rate optimization best practices is the kind of operational resource that fits well after a CAC audit.
A referral program can also lower acquisition costs because the customer does some of the trust-building for you. That doesn’t mean referrals are free, only that they often reduce dependence on paid channels that get more expensive over time. Use them where the product experience is strong enough to support advocacy.
For SMBs and ecommerce teams, the best order is usually:
- Improve conversion first so existing traffic works harder.
- Tighten creative next so paid traffic starts from a stronger position.
- Build retention and referrals so acquisition pressure eases over time.
- Reallocate spend last after the underlying economics are clearer.
I’d also keep an eye on SEO and email, because both can make acquisition less dependent on auction pricing. Mr. Green Marketing, LLC works on SEO, PPC, and email marketing, so it fits naturally as one of the service options teams use when they want acquisition work tied to a broader revenue model, not just cheaper clicks.
Treat the 3 to 1 ratio like a gate, not a trophy
The common 3:1 LTV-to-CAC benchmark is still the sanity check I’d use before scaling a tactic. If a tactic pushes the ratio in the wrong direction, or lengthens payback beyond what the business can carry, it’s not a “growth” tactic, it’s a bill. That’s the filter.
Customer Acquisition Cost: Tools and Templates for Tracking CAC Over Time
A CAC number only helps if you can reproduce it next month and explain what changed. That’s why the stack matters. A messy spreadsheet with inconsistent channel tags is worse than no spreadsheet at all, because it creates confidence without control.
Build the model around a few fixed fields
At minimum, the CAC workbook should include:
- Period
- Channel
- Fully loaded cost
- New customers
- Blended CAC
- Channel-level CAC
- Cohort label
- Payback notes
Keep the numerator split by source, so payroll, agency fees, software, creative, and overhead are visible. Then make the customer count line up with the same period and acquisition source. That gives you a model that can survive board-level questions and day-to-day optimization.
Use dashboards that reduce manual rebuilds
Google Sheets is usually enough for the workbook itself, especially for SMBs and ecommerce teams. Looker Studio works well when you want a lighter dashboard layer, and most CRMs can handle the customer-side inputs if the tagging is disciplined. The point is not fancy tooling. The point is a repeatable system that doesn’t get rebuilt from scratch every month.
A good operating rhythm is simple. Reconcile costs monthly, validate the customer count quarterly, and review channel-level CAC whenever spend shifts materially. If a channel spikes, don’t wait for a quarter-end postmortem to notice it.
For teams that want a measurement framework tied to campaign outcomes, how to measure marketing campaign effectiveness is a useful companion to CAC reporting. It helps keep the metric connected to actual business movement instead of just spreadsheet cleanliness.
Quick Answers on Customer Acquisition Cost
Should you optimize blended CAC or channel-level CAC? Start with the blended number to understand the business, then use channel-level CAC to make decisions. Blended CAC tells you whether the model is healthy overall, while channel CAC shows where the leak or opportunity sits.
How often should CAC be recalculated? Monthly works for operating decisions, and quarterly is better when you need a steadier read. If spend changes quickly, wait too long and the number stops being useful.
When is CAC too high? When it can’t be repaid fast enough through gross margin, retention, and expansion revenue. The number itself isn’t the problem, the payback math is.
Is a higher CAC ever the right choice? Yes, if the customer’s lifetime value, repeat rate, or margin makes the payback acceptable. A higher acquisition cost can be rational if the economics still compound.
What should a first audit focus on? Clean customer counts, fully loaded costs, and channel splits. If those three pieces aren’t reliable, everything else is guesswork.
Mr. Green Marketing, LLC helps SMB and ecommerce teams audit acquisition costs, tighten PPC and SEO performance, and build cleaner reporting around what customers actually cost. If you want a CAC review that connects spend, conversion, and payback in one practical model, visit Mr. Green Marketing, LLC and request a free audit.
Leave a Comment
sing in to post your comment or sign-up if you dont have any account.