
Marketing Budget Allocation: And the budget meeting is tomorrow. Paid search wants more money because it produced the last few sales, the SEO retainer feels difficult to defend, the social campaign is creating attention without obvious revenue, and someone has suggested splitting everything evenly to keep the peace.
That approach feels tidy. It usually isn’t strategic.
Marketing budget allocation works better as a portfolio decision that gets reviewed and rebalanced than as an annual percentage carved into permanent channel budgets. The right mix depends on your business model, sales cycle, margins, customer journey, data quality, and capacity to execute. A local service company, an Amazon seller, and a B2B software firm can all spend intelligently while using very different structures.
The practical aim is simple: protect the channels that reliably create profitable demand, fund the assets that compound over time, and reserve enough money to learn before the market forces you to change. A disciplined digital marketing audit service can expose tracking gaps, duplicated tools, weak landing pages, and channels that look productive only because they receive last-click credit.
The operating principle: Set a defensible starting budget, divide it by business job, test deliberately, and let quarterly evidence change the mix.
Marketing Budget Allocation: Table of Contents
- Why Marketing Budget Allocation Feels Harder Than It Should
- Set Goals KPIs and Your Starting Budget Number
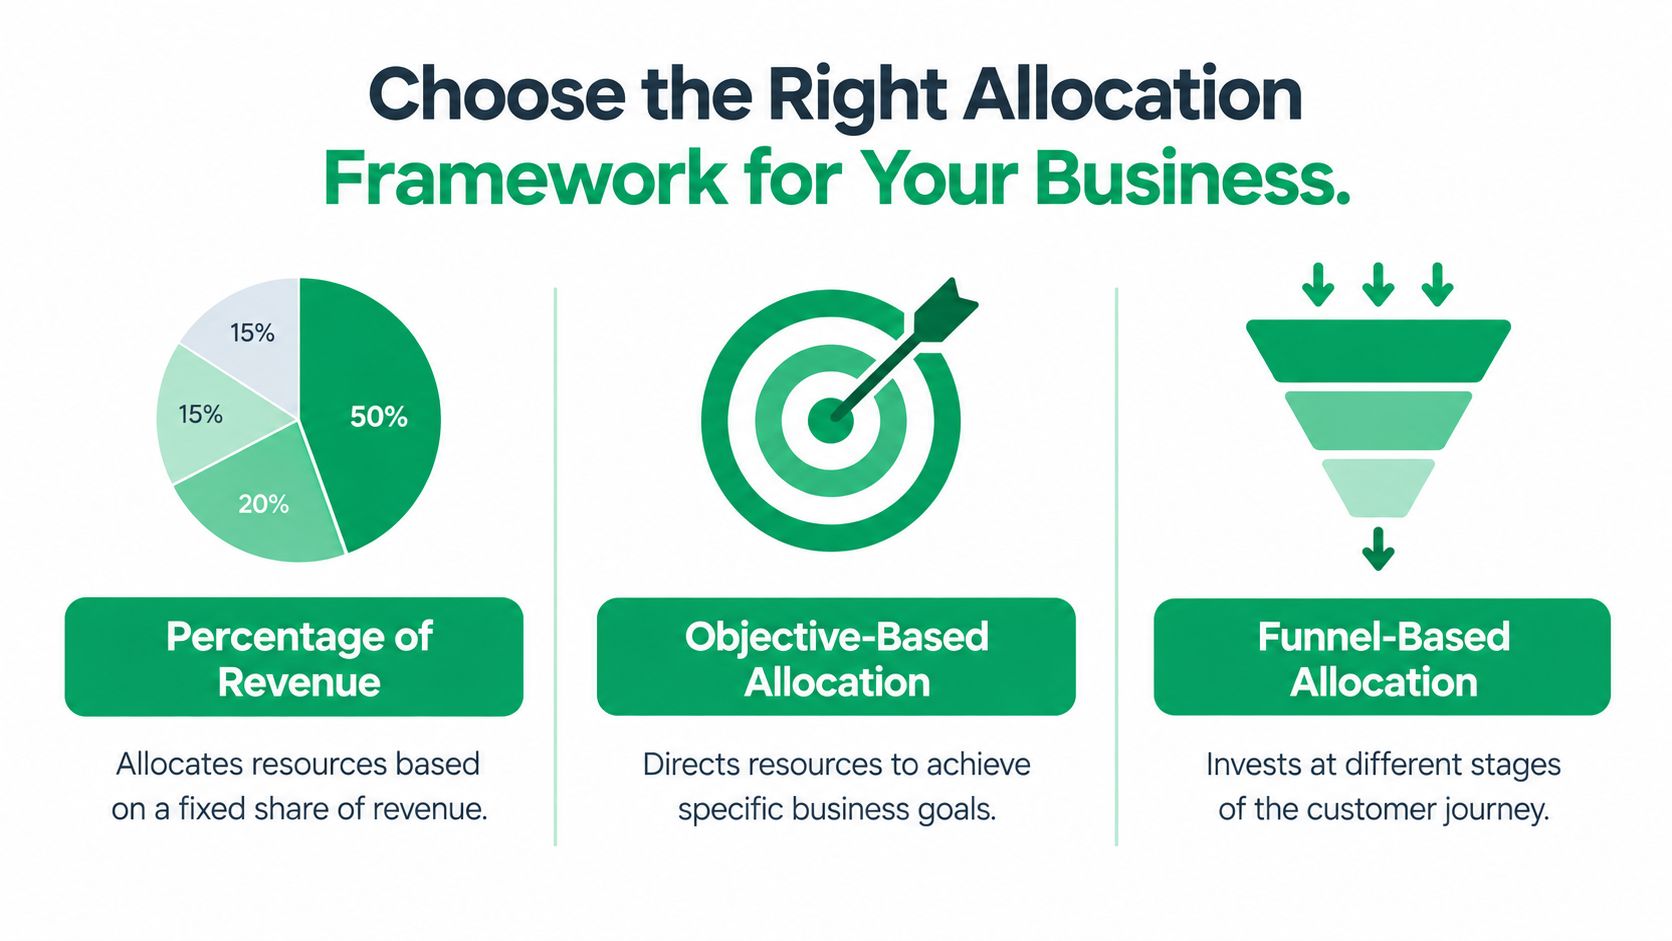
- Choose the Right Allocation Framework for Your Business
- How to Split Budget Across SEO PPC Social Content and Amazon
- Sample Marketing Budget Scenarios by Business Type and Size
- Track Test and Rebalance Your Budget Without Guesswork
Why Marketing Budget Allocation Feels Harder Than It Should
A flat budget cannot keep pace with a changing market. Costs shift, competitors adjust bids, customers discover brands through new surfaces, and sales teams may need more qualified opportunities without accepting a higher acquisition cost. Yet leadership still wants one answer: where should the next dollar go?
Large-company benchmarks show why the brand-versus-performance debate is incomplete. Gartner’s 2025 CMO Spend Survey found average marketing budgets remained at 7.7% of company revenue, unchanged from 2024. Paid media represented roughly 30.6% to 31% of total marketing spend, martech about 22%, internal labor about 22%, and agencies about 21%. Digital channels accounted for 56% or more of spend. These figures describe a structural shift toward measurable media, technology, and operating capability, not a universal formula for every business. The benchmark summary provides the underlying marketing budget allocation figures.
The mistake is turning a benchmark into a habit. A company copies last year’s percentages, keeps every channel active, and calls the result a plan. The harder questions stay unanswered: does each channel support the current objective, has the creative weakened, and is the reported conversion incremental?
The hidden cost of gut-feel splits
Equal funding often rewards internal politics rather than customer behavior. A multi-location home-services brand may need local search coverage, location-specific landing pages, and fast lead response. An Amazon seller may need retail-media efficiency, stronger listings, and promotions that account for inventory. Their budgets should not look alike.
Last-click attribution adds another complication. It favors channels that close an existing purchase, while SEO, content, email nurturing, creator exposure, and offline activity may have shaped demand earlier. Reported attribution should be validated through incrementality testing or marketing mix modeling before it determines the next allocation. The allocation guidance on incrementality and measurement explains why reported attribution needs validation.
A focused digital marketing audit can reveal tracking gaps, duplicated tools, weak landing pages, and channels that appear productive mainly because they receive last-click credit.
What a portfolio approach gives you
A quarterly portfolio review creates three practical disciplines:
- Priority: Give every spend category a job, such as creating demand, capturing intent, converting leads, or retaining customers.
- Protection: Fund proven activity enough to maintain baseline performance, while keeping experiments contained.
- Learning: Use test results to shape the next quarter instead of waiting for an annual planning cycle.
The 70/20/10 structure makes the trade-off visible: protect the core, develop promising opportunities, and reserve a smaller share for controlled experiments. Review the mix by funnel stage and business model. Shift spend when a channel repeatedly misses its role, reaches saturation, or produces weaker incremental results than an available alternative.
That does not mean changing everything every quarter. SEO, lifecycle programs, and brand-building work need continuity. It means reviewing assumptions regularly enough to catch waste, fatigue, and new opportunities before they become expensive problems.
Marketing Budget Allocation: Set Goals KPIs and Your Starting Budget Number
A local-service owner may need more booked consultations, an Amazon seller may need profitable first purchases, and an SMB selling to other businesses may need qualified opportunities. “We need more marketing” does not give the team a usable allocation rule. Define the commercial outcome first, then connect spend to the result that proves progress.
Choose KPIs that match the buying process:
- Pipeline: B2B teams should track qualified opportunities and eventual revenue, not only form submissions.
- Customer acquisition cost: Use it to test whether margin and payback make growth financially safe.
- Return on ad spend: Useful for direct-response campaigns, provided the view includes discounts, fulfillment, creative costs, and contribution margin.
- Retention: Subscription, repeat-purchase, and marketplace businesses need repeat orders or active customers, not email engagement alone.
- Conversion quality: Local-service teams should separate booked jobs and qualified consultations from low-intent inquiries.
A starting budget can come from projected gross sales, historical performance, or a bottom-up calculation based on the objective. Some experts recommend beginning with about 10% of projected gross sales for the coming year, then applying the 70/20/10 portfolio rule, as described in this framework for keeping marketing budgets from going stale. Treat that figure as a planning input, not a required spend level. The number should be reviewed each quarter as performance, capacity, and market conditions change.
Use benchmarks as guardrails
Gartner’s benchmark gives large-company marketers a historical reference point at 7.7% of revenue, but company type changes the interpretation. Reporting based on CMO Survey data places average B2B marketing budgets at 9.4% of revenue, while B2C businesses commonly fall within a 5% to 12% range depending on product and business model. The same reporting describes a reset from a 2021 peak of about 11% to 7.7% in 2024 and 2025. The B2B, B2C, and historical comparison details are summarized in this 2026 marketing budget report.
Those figures are reference points, not instructions. A local service company with strong repeat demand may need a different revenue share from a new consumer brand entering a crowded category. An Amazon seller’s allocation depends on retail margin, inventory availability, organic ranking, and marketplace competition. Use the benchmark to challenge an assumption, then test the proposed budget against cash flow and contribution margin.
Marketing Budget Allocation: Align the room before allocating channels
Agree on four items before anyone argues for Google Ads, TikTok, SEO, or Amazon Sponsored Products:
- The business outcome the budget must support.
- The acceptable acquisition economics, including margin and payback expectations.
- The measurement window, especially when sales do not happen immediately.
- The decision authority for quarterly reallocations.
Build the full cost view before assigning channel percentages. Include media, creative production, software, analytics, freelancers, agency support, landing pages, sales enablement, and retention work. A campaign can look inexpensive until the labor and infrastructure required to run it are counted.
For measurement implementation, analytics and reporting support should connect spend to meaningful business outcomes instead of letting each platform define success independently.
Budget anchor: Set the number from what the business wants to achieve and can afford to learn. Use revenue benchmarks to test whether the assumption is sensible, then shift the quarterly portfolio when incremental results weaken, capacity changes, or a better-tested opportunity appears.
Marketing Budget Allocation: Choose the Right Allocation Framework for Your Business
A local-service company with steady bookings needs a different budget structure from an Amazon seller managing inventory risk or an SMB trying to create demand in a new market. Choose the framework based on revenue predictability, available performance data, sales capacity, and the amount of risk the business can absorb.
| Framework | Strength | Limitation | Best fit |
|---|---|---|---|
| Percentage of revenue | Sets a clear, repeatable spending ceiling | Can preserve weak activity or restrict an ambitious growth plan | Predictable revenue and established operations |
| Objective-based | Connects costs to a defined commercial outcome | Depends on realistic conversion and capacity assumptions | Launches, expansion, lead targets, and growth plans |
| Funnel-based | Balances acquisition with conversion and retention | Stages overlap, which complicates measurement | Businesses with visible customer journeys and lifecycle data |
The percentage model gives finance a simple operating boundary. It suits a mature local brand with stable demand and dependable conversion rates. It becomes less useful when an SMB enters a new market, an Amazon seller adds a product line, or a multi-location business opens a new territory. Historical spending may say little about the investment needed to create demand.
Objective-based allocation works backward from the result. If a sales team needs qualified opportunities, marketing estimates the required volume, conversion assumptions, creative, media, landing pages, and follow-up resources. The process takes more work, but it exposes unrealistic plans early. A lead target without enough sales capacity is not a workable marketing plan.
Funnel allocation assigns budget to awareness, consideration, decision, and retention. Use it to find the constraint. A local-service brand may need more conversion support because traffic already exists, while an Amazon seller may need demand creation before product-page improvements can produce meaningful gains. Funnel guidance should inform the discussion, not dictate a fixed split.
Layer 70/20/10 over the framework
The 70/20/10 rule turns any model into a quarterly portfolio:
- 70% for proven channels: Maintain the revenue engine with reliable paid search, established email flows, productive SEO work, or profitable Amazon campaigns.
- 20% for emerging opportunities: Fund channels showing early traction but limited evidence, such as a new audience, creator partnership, marketplace placement, or content format.
- 10% for experiments: Test ideas that may become useful later without putting core revenue at risk.
Review CPA, ROAS, conversion trends, contribution margin, and operational capacity each quarter. Shift spend when incremental results weaken, inventory or staffing changes, or a tested opportunity can produce more revenue. Keep enough continuity for channels that need time to mature, but do not protect a channel solely because it received last quarter’s budget.
A fixed annual percentage creates inertia. Last-click reporting creates false certainty. Use the growth marketing strategy resource to connect acquisition, experimentation, and retention, then make the next quarterly allocation from evidence rather than habit.
Marketing Budget Allocation: How to Split Budget Across SEO PPC Social Content and Amazon
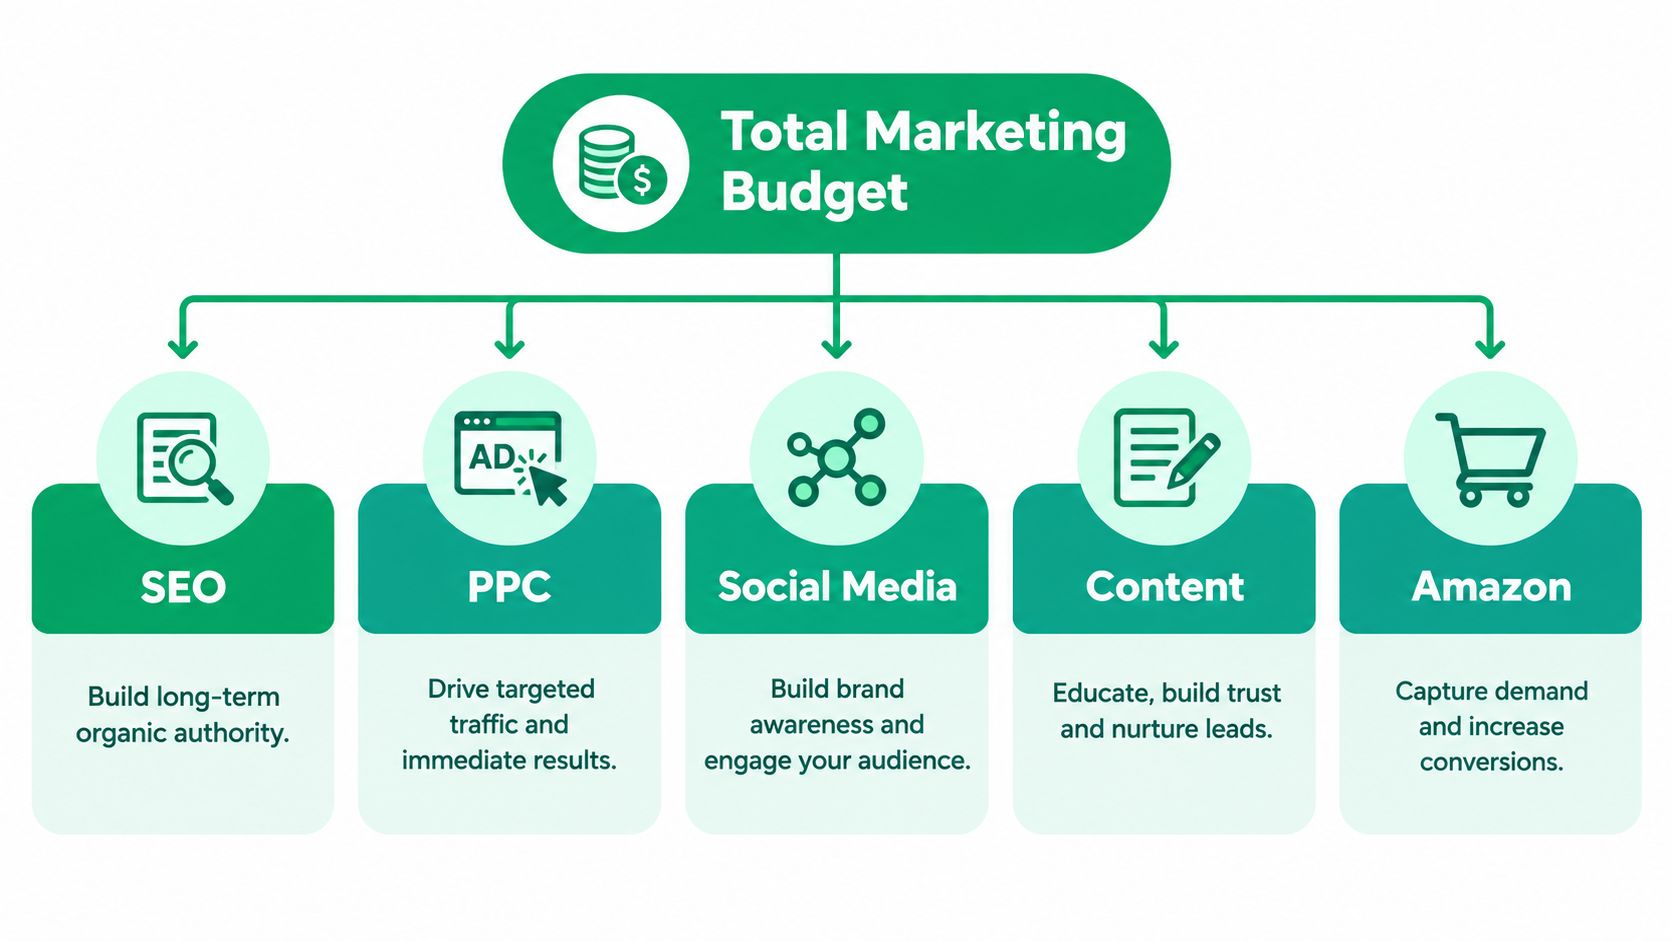
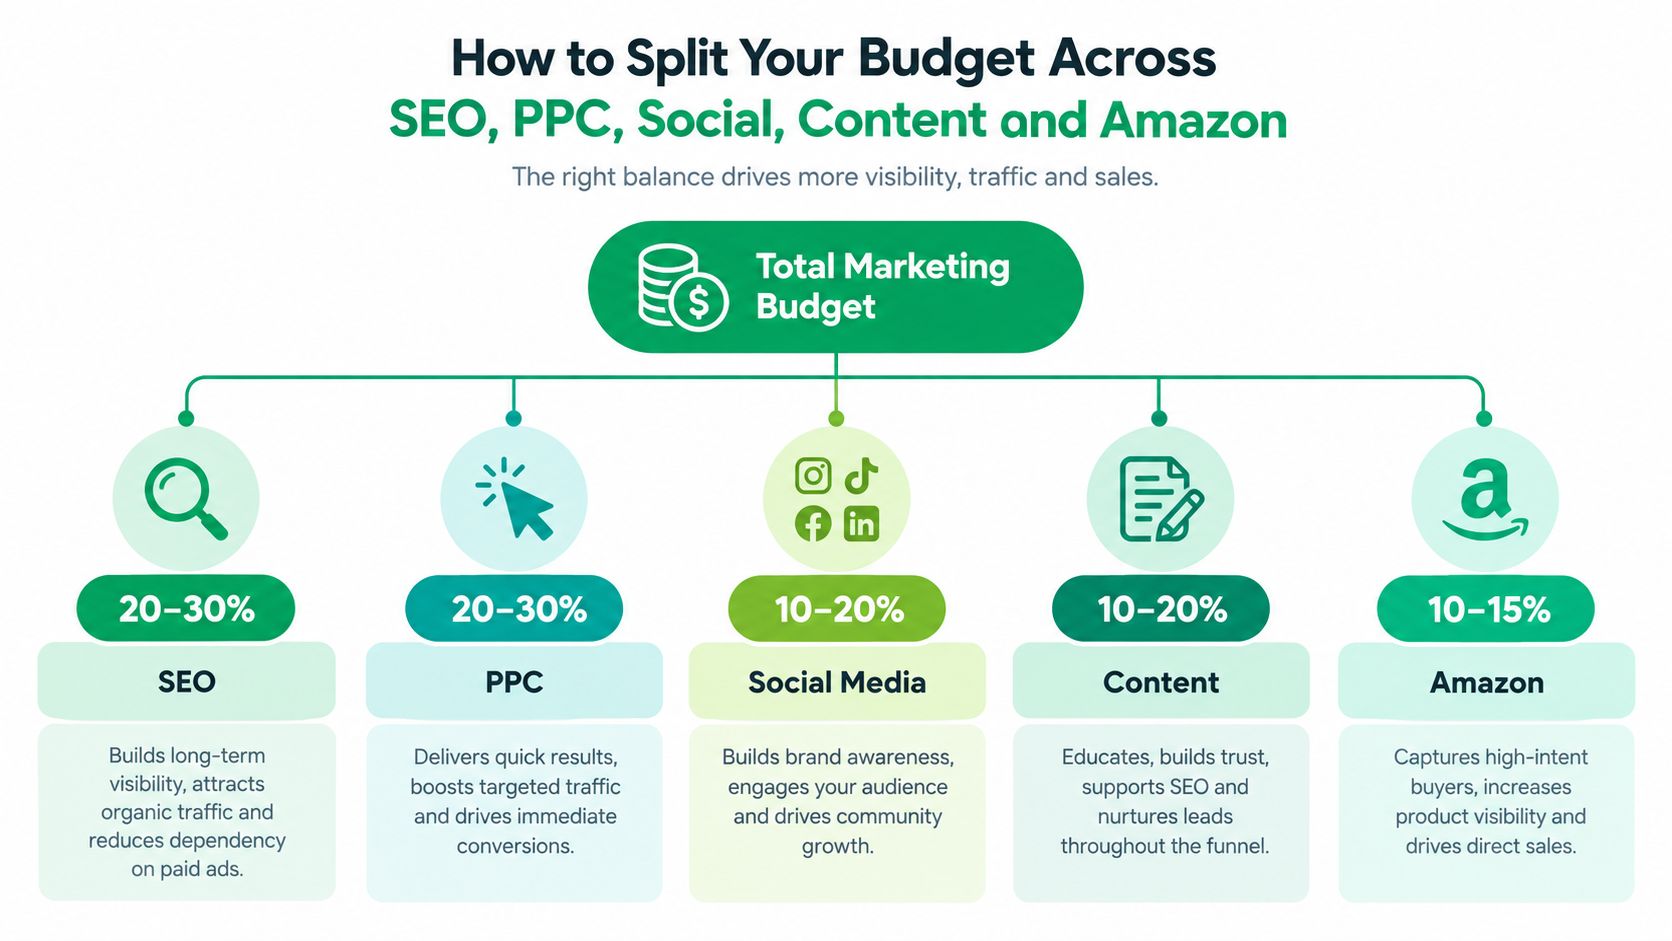
Channel allocation should follow the job each channel performs. SEO isn’t a slower version of PPC, social isn’t just cheaper reach, and Amazon advertising isn’t interchangeable with Google Shopping. Treating them as substitutes produces bad comparisons.
SEO and content build discoverability
SEO earns attention from people who are already searching, but the work also improves the usefulness of the website that paid traffic reaches. Budget covers technical work, information architecture, research, editorial production, updates, internal linking, digital PR, and conversion improvements.
Overweight SEO when the business has durable search demand, strong customer value, and the patience to build an asset. Pull back from broad content production when pages don’t map to buyer questions, commercial intent, or a realistic path to conversion. Publishing volume isn’t a strategy.
Content should also support AI-search discovery. That may include clear answers, structured pages, transcripts, schema, brand-mention audits, newsletters, podcasts, and video. These assets function as distribution infrastructure. They can support organic discovery, sales enablement, retargeting, and customer education rather than living in a narrow “blog” line item.
Marketing Budget Allocation: PPC captures existing intent
Paid search is valuable when demand already exists and the business can convert it quickly. Cost drivers include competition, geography, keyword intent, landing-page quality, creative, tracking, and sales follow-up. Branded search may show strong ROAS while contributing less incremental demand, so it shouldn’t automatically receive every available dollar.
Use PPC to harvest high-intent demand, protect important markets, and gather message data. Reduce spend when campaigns exceed acceptable acquisition economics, when lead quality falls, or when additional impressions mostly reach people who would have converted anyway. A properly scoped advertising cost assessment should include campaign management and conversion infrastructure, not just the media bill.
Social creates demand and supports remarketing
Paid social can introduce a product to audiences who aren’t actively searching. It needs strong creative testing, audience discipline, landing-page alignment, and enough variation to avoid fatigue. Organic social, creator activity, and community participation can extend the useful life of paid creative, but they still require production time.
Fund social more heavily when the offer is visually demonstrable, the audience responds to education or entertainment, and the business can measure assisted demand. Pull back when engagement doesn’t translate into qualified visits, product consideration, email growth, or sales activity.
Amazon requires retail-media context
Amazon sellers must connect advertising to retail fundamentals. Sponsored Products, Sponsored Brands, DSP, video, coupons, reviews, inventory, pricing, listing content, and organic ranking interact. A campaign can look efficient while total advertising cost of sales rises because the seller is buying demand that the listing fails to convert.
Allocate around product economics and lifecycle. New launches may need discovery and review velocity, while established products may need defensive coverage, profitable keyword harvesting, and seasonal event planning. Track total advertising cost of sales, contribution margin, organic sales, and inventory risk together.
Marketing Budget Allocation: Owned and lifecycle assets deserve a seat
Newsletters, email automation, CRM hygiene, post-purchase education, referral programs, transcripts, podcasts, and reusable video can compound across channels. Recent benchmark summaries describe paid search at 24.6% and paid social at 11.8%, with affiliate at 2.8%, influencer and creator activity at 4.2%, and roughly 2% to 4% sometimes reserved for AI-search discovery. They also describe digital spend at around 61% or more in the referenced mix. The channel and AI-search allocation context appears in this 2026 benchmark discussion.
Those figures are directional, not a template. If acquisition is well funded but lifecycle is weak, the next dollar may improve revenue more effectively through retention and conversion infrastructure.
Marketing Budget Allocation: Sample Marketing Budget Scenarios by Business Type and Size
Annual percentages are useful starting points, but quarterly allocation should follow economics, funnel constraints, and incrementality. The examples below are planning models, not benchmarks. Replace them with your margin, sales capacity, seasonality, inventory position, and historical performance.
| Business Scenario | Assumed Revenue and Budget % | Example Channel Split |
|---|---|---|
| Local service provider | $500,000 revenue, 10% budget, or $50,000 | $20,000 paid search and local campaigns, $12,500 website and conversion work, $10,000 local SEO and content, $5,000 retention and referrals, $2,500 testing |
| SMB e-commerce brand | $2 million revenue, 8% budget, or $160,000 | $64,000 PPC and shopping, $32,000 paid social, $24,000 SEO and content, $24,000 email and lifecycle, $16,000 creative and conversion testing |
| Amazon seller scaling marketplace spend | Revenue should be set from the seller’s forecast, with the budget tied to contribution margin and inventory capacity | Sponsored Ads receive the proven core allocation, emerging funds support DSP, video, or new audiences, and experimental funds test product, keyword, and event opportunities |
Use a 70/20/10 portfolio as a control: 70% supports proven activity, 20% funds adjacent opportunities, and 10% tests uncertain ideas. Map each portion to the funnel. For a local service provider, paid search may capture demand, while website conversion, call handling, reviews, location pages, and follow-up determine whether that demand becomes booked work. If response time or appointment capacity limits bookings, shift the next quarter’s spend toward those constraints instead of buying more clicks.
The SMB e-commerce brand needs acquisition and retention working together. Paid media can scale faster than organic channels, while email, product education, merchandising, and conversion testing raise the value of traffic already purchased. Plan seasonal investment before demand peaks, rather than pulling money from every other channel once the peak arrives.
Amazon requires a separate portfolio view. Marketplace visibility, retail conversion, inventory, and advertising interact, so allocate by product lifecycle and event calendar. Keep the proven Sponsored Ads allocation in the 70% core, use 20% for DSP, video, or new audiences, and reserve 10% for product, keyword, and event tests. Judge results with total advertising cost of sales, contribution margin, organic sales, and inventory risk, not one campaign metric.
B2B businesses may justify a higher revenue share than consumer-facing businesses in some contexts. CMO Survey reporting cited a 9.4% average for B2B firms, while B2C budgets commonly range from 5% to 12% depending on the model. The company-type benchmark source explains why these figures need contextual interpretation. A lumpy business should model cash timing, not annual revenue alone.
Scenario rule: Copy the structure, not the percentages. Shift spend next quarter when an activity creates incremental profitable demand, or when a funnel, capacity, margin, or inventory constraint makes another use of the budget more valuable.
Marketing Budget Allocation: Track Test and Rebalance Your Budget Without Guesswork
A quarterly review needs consistent definitions, clean cost data, and a decision rule the team will follow. A complicated dashboard is optional.
Track spend, qualified conversions, revenue, margin where available, CAC, ROAS, retention, and sales-cycle timing by channel and campaign. Separate platform-reported results from blended business results. A paid platform may claim a conversion, while finance needs to know whether the customer was profitable and whether the sale would likely have happened without the exposure.
Build a measurement loop
Use three layers:
- Operational reporting: Review spend, pacing, conversion quality, and tracking failures often enough to stop waste.
- Incrementality testing: Hold out a comparable audience, geography, time period, or campaign condition when the business can do so safely. Measure additional outcomes, not appearances in the conversion path.
- Marketing mix modeling: Businesses with consistent historical data can estimate how channel investment relates to aggregate outcomes while accounting for broader conditions.
Attribution helps diagnose performance, but it should not determine allocation alone. Fragmented data and uncalibrated attribution windows can make a closing channel look stronger than a demand-creating channel.

Marketing Budget Allocation: Apply a clear shift rule
Review the plan quarterly and move money only when evidence supports the move. The published portfolio framework recommends reassessing CPA, ROAS, and conversion trends, reallocating when actual ROI diverges from plan by more than 20%, and gathering 4 to 6 weeks of test data before scaling an experiment. Use the documented rebalancing and test-duration guidance as a practical reference.
One noisy week is not enough. Shift spend when a channel repeatedly misses its economic target, incremental lift is weak, creative fatigue is clear, or another channel has room to scale without damaging efficiency.
Flat budgets create trade-offs between people, agencies, software, and experimentation. Gartner-linked coverage says budgets held at 7.7% of revenue in 2025 and edged to 7.8% in 2026, while teams redistributed spending across talent, technology, and agencies. Another 2026 summary reports 31.4% of budget going to external agencies and freelancers versus 68.6% in-house. The coverage of flat budgets and capability trade-offs appears in this Campaign article.
Protect the capability required to execute. Cutting analyst support, creative resources, or conversion work can make the media spreadsheet look leaner while weakening every channel. A marketing campaign effectiveness measurement process connects those operating decisions to commercial outcomes.
Quarterly checklist: Keep the proven core funded, reserve 20% for emerging opportunities and 10% for experiments, test new ideas with 5% to 10% of spend for 4 to 6 weeks, validate reported performance with incrementality where possible, and shift money when actual ROI is more than 20% away from plan.
Mr. Green Marketing, LLC helps SMBs, Amazon sellers, local service providers, and multi-location brands connect SEO, PPC, web conversion, Amazon advertising, lifecycle marketing, and AI-search discovery to measurable goals. Visit Mr. Green Marketing, LLC to request a free audit and performance report, identify allocation gaps, and build a quarterly budget plan around channels that can support profitable growth.
Leave a Comment
sing in to post your comment or sign-up if you dont have any account.