
E-commerce Growth Strategy: And the most popular e-commerce growth advice is usually the least complete: buy more traffic, publish more content, and scale the ads that appear to work. That approach can grow sessions while leaving the checkout, fulfillment operation, and mobile experience leaking revenue underneath. A store doesn’t have a traffic problem if it can’t turn existing buying intent into profitable orders.
Global commerce makes that distinction harder to ignore. UNCTAD reports that e-commerce sales across 45 developed and developing economies reached $28 trillion in 2024, covering countries representing three quarters of global GDP and exports, with sales still 4.4% higher than in 2023 (Trade.gov’s e-commerce market data). Trade.gov projects global B2C e-commerce revenue will reach $5.5 trillion by 2027, growing at a 14.4% compound annual growth rate (Trade.gov’s e-commerce forecast). Demand is expanding. The difficult work is capturing a profitable share of it.
A practical e-commerce growth strategy treats the business as one connected system. Acquisition, product discovery, landing pages, checkout, payment methods, delivery promises, returns, retention, and reporting all influence the same commercial outcome. Fix one weak link before adding fuel to the next.
E-commerce Growth Strategy: Table of Contents
- Rethinking the E-commerce Growth Strategy
- Prioritizing Channels and Role-Specific Tactics
- Fixing the Checkout and Mobile Conversion Gap
- Post-Purchase Economics and Fulfillment Levers
- Market Expansion and Cross-Border Readiness
- Measurement and KPIs That Actually Matter
- Example Playbooks and 90-Day Roadmaps
Rethinking the E-commerce Growth Strategy
Traffic is easy to report and expensive to misread. Sessions rise, paid reach looks healthy, and another acquisition budget gets approved while shoppers abandon orders at shipping or payment. That sequence sends more visitors into the same broken path.
E-commerce conversion-rate benchmarks commonly place global performance around 1.7% to 2.7%, with 2% to 3% often used as a working baseline and 3% or higher viewed as strong for many merchants (Blend Commerce’s benchmark summary). These figures are reference points, not targets to copy. Results vary by traffic source, device, product category, price point, and customer intent. A blended rate can hide a weak acquisition channel when returning customers with strong intent offset poor first-time performance.
Practical rule: Diagnose the leak before increasing the flow.
A modern growth marketing strategy asks where a qualified shopper stops progressing. Weak product-page engagement points to relevance, merchandising, or offer clarity. Full carts with few completed orders point to checkout friction, payment coverage, shipping surprises, or trust concerns. First orders without repeat purchases require an examination of product expectations, delivery, support, and post-purchase communication.
Growth is a systems problem
The commercial equation is straightforward: qualified demand multiplied by conversion, healthy pricing, and reliable availability. A brand can improve one factor and still stall when another fails. Advertising cannot compensate for an out-of-stock hero product, while warehouse speed cannot fix unclear product information or a difficult mobile journey.
Run a short diagnostic before changing channels:
- Demand quality: Which sources produce product views, add-to-cart actions, completed orders, and returning customers?
- Experience quality: Where do shoppers meet confusing copy, slow pages, missing trust signals, or unnecessary steps?
- Economic quality: Does each order retain enough margin after media, shipping, payment fees, returns, and support?
- Operational quality: Can inventory, delivery, and returns support the promise made in the ad?
The largest leak may sit after the sale. Late delivery, unclear tracking, and difficult returns can reduce repeat demand even when the first transaction looks profitable. Mobile shoppers expose these weaknesses faster because small forms, slow pages, and limited payment options consume more patience.
Global retail e-commerce accounted for 19.9% of all retail sales in 2024, rising to 20.5% in 2025 and projected to reach 21.1% in 2026, according to CartFlows’ published statistics (CartFlows e-commerce conversion statistics). Online demand matters. Profitable growth depends on finding the structural failure that blocks the next order, then fixing that failure before buying more traffic.
E-commerce Growth Strategy: Prioritizing Channels and Role-Specific Tactics
You can’t build every channel properly at the same time. The right order depends on whether the brand needs discovery, immediate demand, marketplace reach, or a more defensible owned audience.
Start with the business constraint
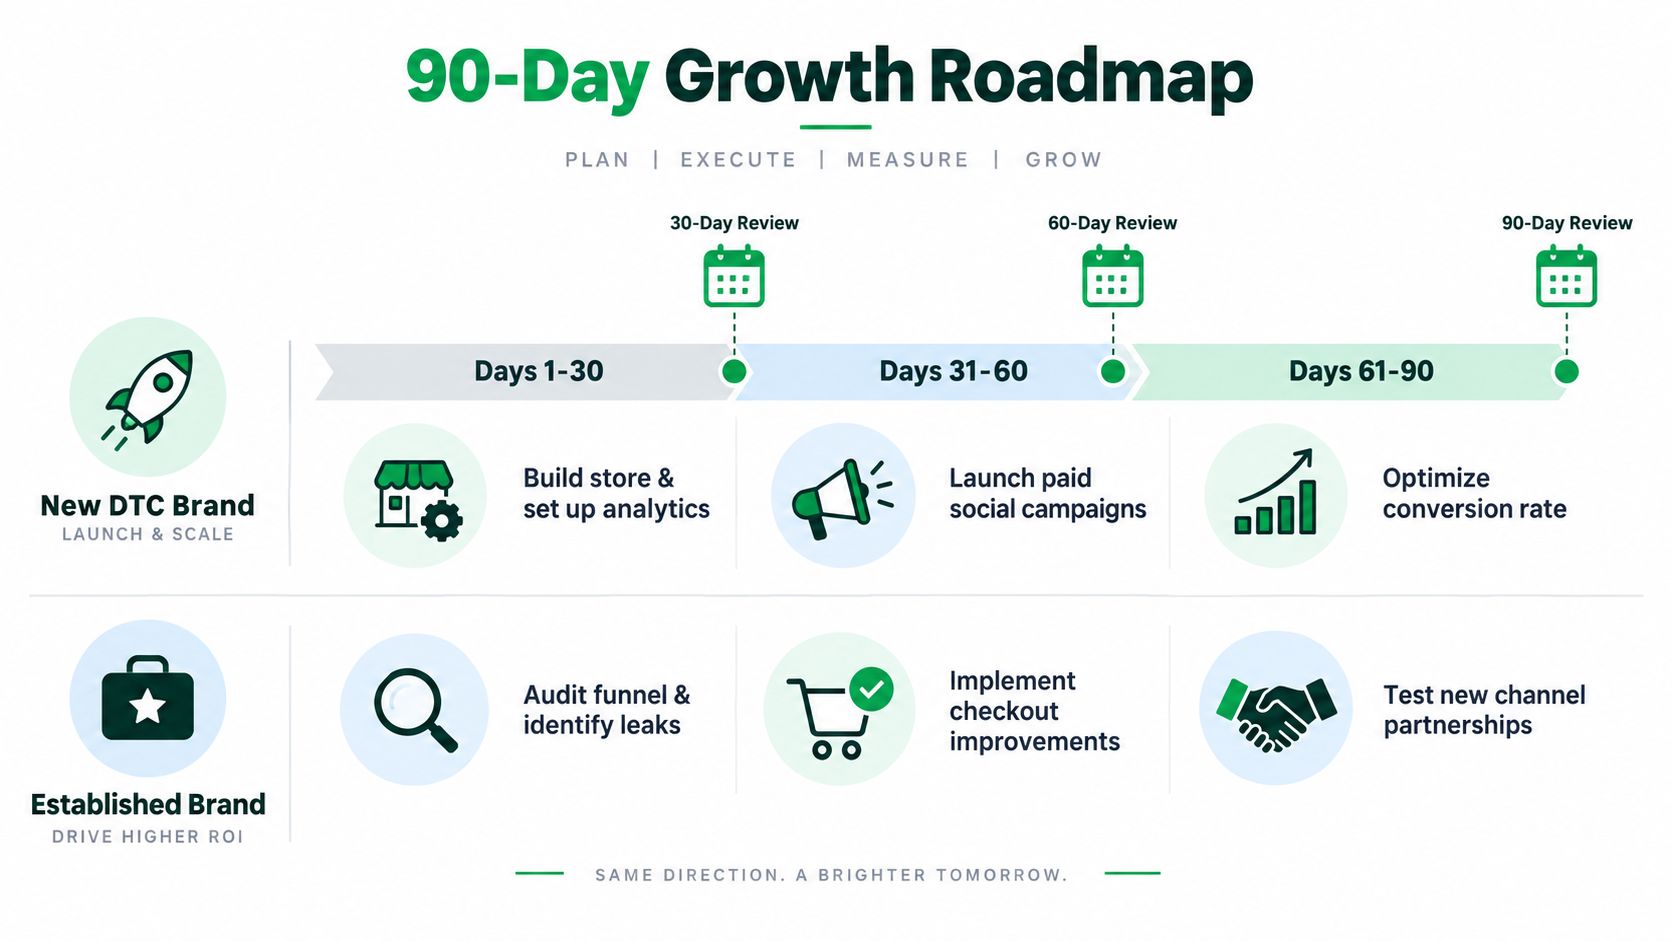
A new direct-to-consumer brand usually needs fast learning before it invests heavily in long-cycle organic growth. A mature store with repeat demand may have the opposite problem, poor segmentation and an underperforming mobile funnel. An established Amazon vendor already has marketplace intent but may lack control over customer data, merchandising depth, and brand experience.
Use this sequence:
- Stabilize the store first. Make product pages clear, install trustworthy analytics, verify inventory feeds, test payment methods, and complete a mobile checkout journey. Paid traffic amplifies whatever experience already exists, including the bad parts.
- Choose one primary acquisition engine. SEO is a compounding asset for brands with useful expertise and a broad product range. PPC is faster for testing offers, audiences, and search intent. Amazon is powerful when shoppers already search by product category and the brand can maintain listing quality, availability, and margin.
- Add a second channel only when the first produces usable learning. Don’t treat a channel as successful because it generates clicks. Require evidence that the source creates qualified sessions, completed orders, and acceptable contribution after variable costs.
- Build a channel-specific landing experience. A Google Shopping visitor, an editorial SEO reader, and an Amazon shopper don’t arrive with the same expectations. Send each to the page that answers its actual buying question.
E-commerce Growth Strategy: Match tactics to maturity
SEO works best when the team can publish useful category, comparison, buying-guide, and product-support content, then connect that content to strong commercial pages. Don’t chase broad keywords without inventory, differentiation, or a clear internal-linking path to purchase.
PPC earns its place when the brand needs controlled testing. Separate branded, non-branded, shopping, remarketing, and prospecting campaigns so performance doesn’t collapse into one flattering average. Test the offer and landing page, not only the audience.
Amazon demands retail discipline. Improve titles, images, bullets, search terms, reviews, advertising structure, inventory planning, and Buy Box health as one operating system. A polished listing won’t help if the product goes unavailable, and a strong ad won’t fix a weak detail page.
For a deeper channel plan, see these e-commerce marketing strategies. The objective isn’t to be present everywhere. It’s to give each channel a job, a budget boundary, and a clear handoff into the next stage of the customer journey.
E-commerce Growth Strategy: Fixing the Checkout and Mobile Conversion Gap
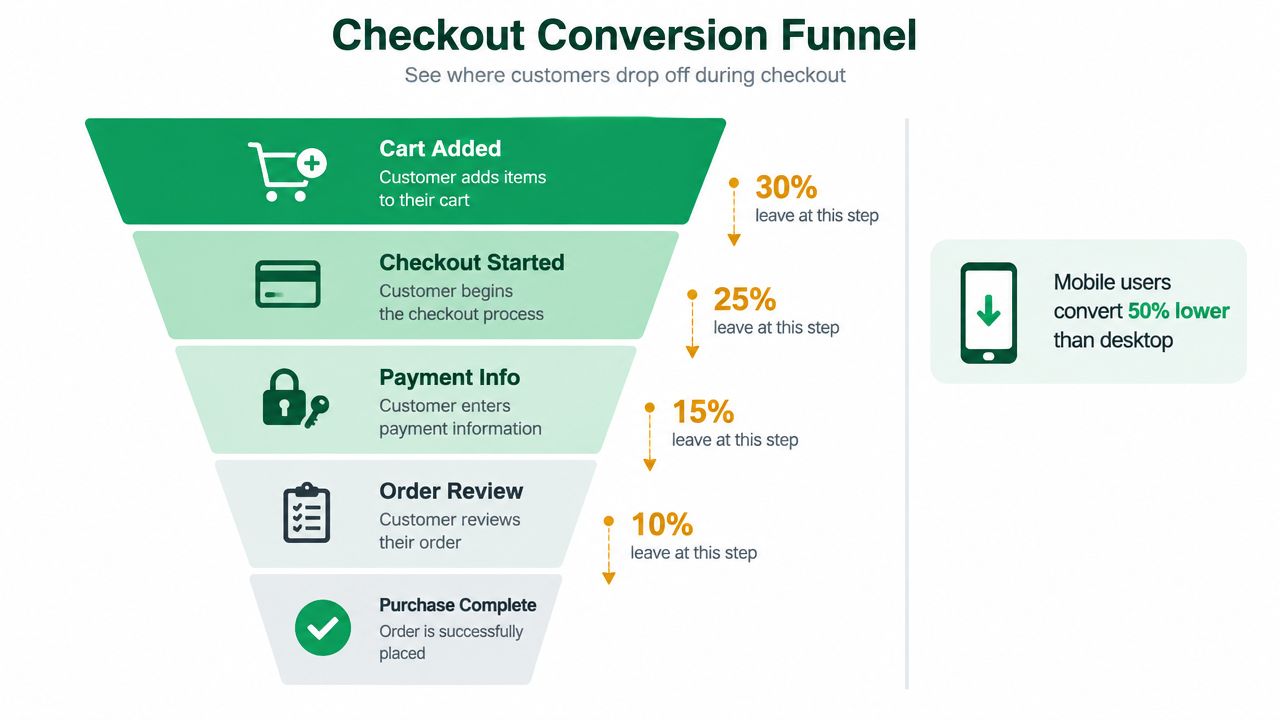
Traffic rarely causes the final loss. Checkout friction does. A shopper has chosen a product, invested time, and started payment, then encounters uncertainty about cost, delivery, or the form itself.
Baymard-based benchmark summaries place global cart abandonment at about 70.22%, so roughly seven in ten filled carts do not become completed orders (Eightx’s cart abandonment benchmark summary). Unexpected costs account for roughly 48% of abandonment in Baymard-linked reporting. Delivery, taxes, fees, and returns information therefore belong in conversion design, not an operations document (DHL’s 2026 e-commerce trends reporting).
Mobile needs its own workstream. Market summaries put mobile at roughly 59% to 60% of global online retail revenue (Global Statistics mobile commerce data). One benchmark places mobile conversion around 2.49%, compared with 3.65% on desktop, while another reports mobile around 2.8% to 2.85% and desktop around 3.9% (Koongo’s 2026 e-commerce statistics). The largest traffic segment can still produce the weakest completion rate.
Run a friction audit
Walk through the journey as a customer, using a real phone and a test order:
- Product page: Show delivery expectations, total-cost signals, returns, sizing or specifications, reviews, and payment options before commitment.
- Cart: Make quantity changes, discount entry, shipping estimates, and product removal obvious. Reveal important costs early.
- Account creation: Offer guest checkout. Invite account creation after the order, once the customer has received value.
- Forms: Remove unnecessary fields, enable browser autofill, and use error messages that preserve entered information.
- Payment: Offer trusted local and digital methods where the customer base uses them. Card-only checkout creates avoidable hesitation.
- Mobile layout: Keep the primary action visible, reduce taps, avoid intrusive pop-ups, and test keyboards, address fields, scrolling, and one-handed use.
A separate market summary reports mobile abandonment as high as 85.65%, while other summaries place it between 76% and 80%, above the all-device benchmark (Quantumrun’s e-commerce business statistics). Treat mobile checkout as a revenue product, not a responsive afterthought. Use this mobile website optimization guide to structure the implementation review.
E-commerce Growth Strategy: Post-Purchase Economics and Fulfillment Levers
The order confirmation starts the operating test. Acquisition creates the expectation. Fulfillment determines whether the order earns trust, margin, and a second purchase.
Delivery speed matters, but smaller brands should not promise the fastest possible service by default. Expedited fulfillment can consume margin, complicate inventory, and train customers to expect an uneconomic standard. Set a clear service level, show its cost before payment, and meet the promise consistently.
Returns need the same discipline. A generous policy can reduce hesitation, yet reverse logistics, inspection, repackaging, refunds, and support all carry costs. A restrictive policy may protect margin while lowering conversion and weakening trust. Match the policy to the product category, defect risk, sizing uncertainty, customer value, and the cost of keeping or recovering inventory.
Make convenience selective
When margins are tight, fund convenience where it removes the most hesitation:
- Payment options: Start with the methods customers already use. Review authorization failures and support tickets before adding more complexity.
- Delivery choices: Make the economical option clear, then offer faster service when urgency justifies the price.
- Returns: Explain eligibility, timing, fees, and refund mechanics before purchase. Ambiguity drives abandonment and post-purchase complaints.
- Order communication: Confirm what was purchased, what happens next, and how customers can get help. Silence turns small delays into perceived service failures.
DHL identifies delivery, returns, payments, AI, and sustainability as major friction points and growth levers in its 2026 trend reporting (DHL’s e-commerce trends report). FedEx’s 2025 shopper report, referenced in the same verified market context, emphasizes convenience and an exceptional post-purchase experience. The practical conclusion is straightforward: fulfillment affects conversion, repeat purchase behavior, support volume, and brand credibility, not only operating cost.
Use operations data to decide where to spend. Repeated “where is my order?” requests point to tracking and proactive update gaps. Returns clustered around fit or specifications point to merchandising problems before they point to a traffic problem. Slow refunds require workflow repair. A structured loyalty program design can support repeat behavior, but it cannot offset a disappointing first delivery.
E-commerce Growth Strategy: Market Expansion and Cross-Border Readiness
When domestic acquisition costs rise, increasing the ad budget is only one option. A better market can improve growth economics, provided the operating model can support it.
UNCTAD data indicates that, from 2016 through 2024, average annual e-commerce sales growth in developing economies was almost double the rate in developed economies. That pattern does not make every emerging market attractive. It does show why mature-market saturation should not determine every expansion decision.
TradeByte expects global retail e-commerce to reach $7 trillion in 2026. China, the United States, and Western Europe still account for about 80% of sales, while growth shifts toward Central and Eastern Europe, the Nordics, the Middle East, India, and Turkey (TradeByte’s 2026 market overview). A mid-sized brand does not need to enter the biggest markets first. It needs a market where demand, competition, logistics, payments, compliance, and internal capacity fit together.

Compare markets by readiness
| Question | Mature market | Cross-border opportunity |
|---|---|---|
| Demand | Larger, more established search volume | May offer less contested category demand |
| Competition | Strong brands and expensive attention | Competition varies by category and channel |
| Localization | Requires sharper differentiation | Language, pricing, and cultural fit still matter |
| Operations | Domestic delivery may be simpler | Duties, returns, payments, and delivery require planning |
| Strategic role | Defend share and improve efficiency | Diversify revenue and find new demand |
Translation is only the starting point. Review product names, currencies, payment preferences, delivery promises, tax treatment, support coverage, marketplace rules, and returns. Then test one market with a controlled assortment and a defined service promise.
Treat the pilot as an operating test, not only a demand test. Track contribution after duties, refunds, support, and delivery exceptions. A market that converts well but produces expensive returns or unreliable fulfillment may be a poor expansion choice.
Channel selection matters as much as geography. Product discovery is spread across search, social platforms, marketplaces, and retailer ecosystems. A focused entry using the right channel mix is safer than copying the domestic playbook across every market.
E-commerce Growth Strategy: Measurement and KPIs That Actually Matter
A clean dashboard can still produce bad decisions. Aggregate conversion rate, blended ROAS, and total revenue often hide the leaks that matter most: differences between new and returning customers, mobile and desktop users, paid and organic traffic, or one product group and another.
Set a consistent unit of analysis before reviewing performance. Each weekly meeting should separate at least channel, device, customer cohort, product group, and market. Conversion rates vary with traffic source, device mix, industry, and price point, so one store-wide CVR can conceal a weak landing page or a checkout issue on mobile.
Build the dashboard around decisions
| Funnel Stage | Key Metric | Strategic Purpose |
|---|---|---|
| Discovery | Qualified sessions and click-through rate | Determine whether the channel attracts relevant demand |
| Consideration | Product views, engagement, and add-to-cart rate | Test merchandising, message clarity, and offer relevance |
| Checkout | Checkout starts, payment errors, and completion rate | Locate friction inside the transaction |
| Purchase | Contribution margin per order and blended acquisition cost | Decide whether growth is economically sustainable |
| Retention | Repeat purchase behavior, refund rate, and customer value | Judge whether the first order creates a durable relationship |
Use contribution margin, not revenue alone, to compare channels. Subtract product cost, payment fees, shipping subsidy, discounts, returns, and variable support costs before assigning more budget. A channel with lower top-line ROAS may still create more value when its customers reorder and return fewer products.
A metric earns its place by changing an operating decision.
Segment before scaling
Review new customers separately from existing customers. Compare mobile and desktop checkout completion, then split paid search into brand and non-brand intent. For Amazon, separate advertising-driven sales from organic marketplace sales, and monitor inventory availability beside media results. Otherwise, a stockout or delivery problem can look like a campaign problem.
The reporting system should answer one question every time: what action will this number change? If no one can answer, remove the metric or move it to a reference view. A practical analytics and reporting framework gives marketing, merchandising, finance, and operations the same definitions, even when each team works from a different dashboard. That shared language makes it easier to trace revenue leaks from acquisition through checkout, fulfillment, refunds, and repeat purchase.
Example Playbooks and 90-Day Roadmaps
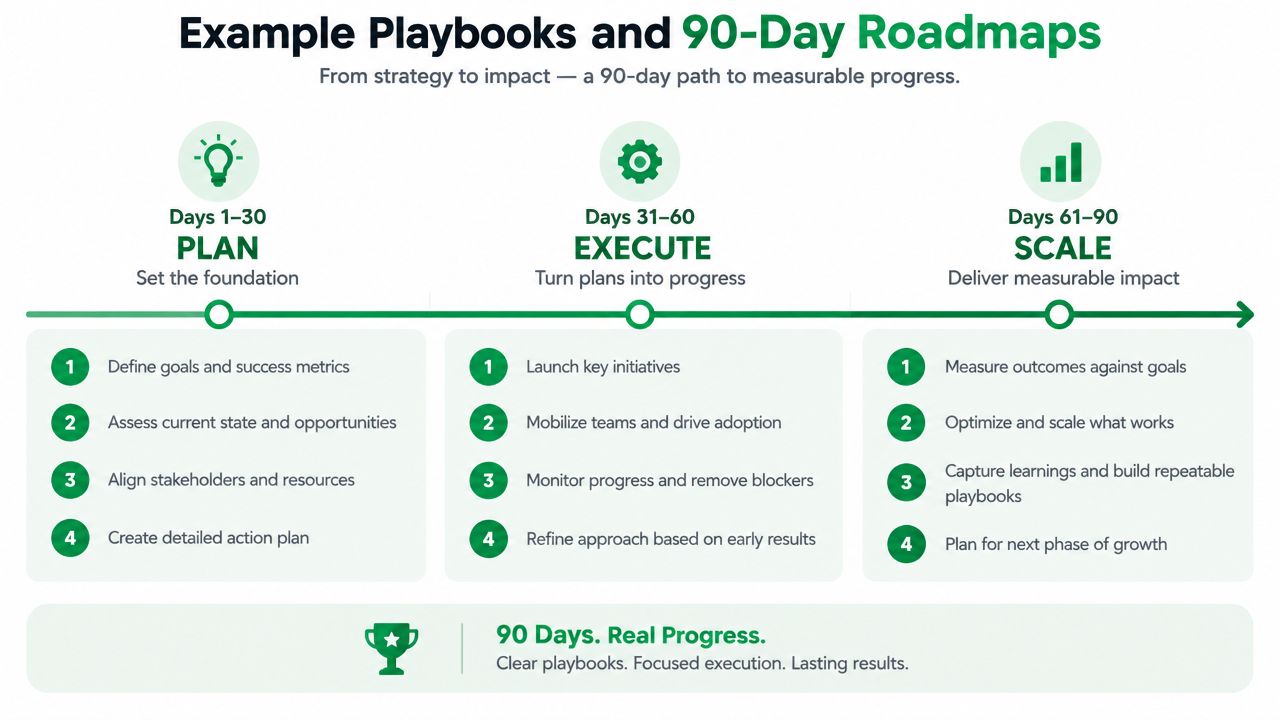
A new DTC brand and an established Amazon seller shouldn’t receive the same growth plan. Their constraints differ, so their first ninety days should produce different evidence.
Playbook one for a new DTC brand
Days 1 to 30 are for instrumentation and clarity. Build the storefront around the customer’s buying questions, not the founder’s product vocabulary. Configure analytics events for product views, cart additions, checkout stages, payment errors, purchases, refunds, and device type. Prepare a small set of search-focused pages and establish a content brief based on real category questions.
During this phase, don’t scale media. Run controlled tests that reveal which message, offer, and audience combination attracts qualified behavior. Verify that the store works on common mobile paths before increasing spend.
Days 31 to 60 are for demand testing. Launch tightly structured paid social or search campaigns with separate landing pages where intent differs. Use creative to test the problem, proof, product benefit, and offer. Keep a record of what happens after the click, not just which ad earns the cheapest visit.
Days 61 to 90 are for conversion work. Prioritize the highest-volume leak. If mobile users add to cart but fail at payment, fix payment and form friction. If product pages fail to create carts, improve demonstrations, reviews, comparison content, and delivery clarity. SEO foundations continue, but the team shouldn’t bury urgent checkout work under a long editorial calendar.
Playbook two for an established Amazon seller
The first month should map marketplace economics and owned-channel gaps. Audit listings, advertising structure, inventory availability, pricing, branded search, customer questions, and the reasons shoppers contact support. Select a narrow Shopify assortment rather than moving every SKU immediately.
The second month should connect the storefront to the brand promise. Build product pages with richer education, comparison tools, bundles, email capture, and post-purchase flows. Protect Amazon performance while testing which products and audiences respond to owned-channel merchandising.
The third month should test channel partnerships, creator content, search campaigns, and retention offers. Keep inventory and margin reporting visible beside marketing results. A channel that grows orders while creating stockouts or unprofitable returns isn’t scaling the business.
The most useful 90-day outcome isn’t a dramatic headline. It’s a clearer operating model, a measured funnel, a prioritized backlog, and enough evidence to decide what deserves the next investment.
Mr. Green Marketing, LLC helps brands connect web design, SEO, PPC, Amazon marketing, analytics, and conversion-focused execution into a practical e-commerce growth strategy. Visit Mr. Green Marketing, LLC to request a free audit and performance report, then use the findings to prioritize the revenue leaks worth fixing first.
Leave a Comment
sing in to post your comment or sign-up if you dont have any account.