
Transparent Reporting: More data is not the same as more trust. That advice sounds sensible, but it has led countless teams to publish crowded dashboards that obscure weak definitions, inconsistent sources, and unanswered business questions. Transparent reporting isn’t a design exercise. It’s an operating system for deciding what gets measured, who can interpret it, and what happens when the numbers look wrong.
After rebuilding reporting systems for more than 20 clients, I’ve found that the hardest problems rarely involve charts. They involve ownership, documentation, permissions, stale pipelines, and uncomfortable conversations about performance. A polished dashboard can make a weak process look credible until a client asks where a number came from.
The practical standard is higher. Users should be able to judge a dataset’s fitness for use by reviewing its methodology, collection procedures, inclusion and exclusion criteria, and documented deviations, as explained in the FCSM guidance on transparent reporting. That principle applies equally to marketing reports, financial disclosures, research findings, and operational scorecards.
Transparent Reporting: Table of Contents
- Why More Data Doesn’t Mean Better Reporting
- What Transparent Reporting Requires
- The Metrics That Matter for Business Growth
- Choosing the Right Reporting Cadence and Format
- Real Implementation Stories and Lessons Learned
- Building Governance That Makes Transparency Sustainable
- Your Transparent Reporting Implementation Checklist
Transparent Reporting: Why More Data Doesn’t Mean Better Reporting
The popular assumption is simple: if a dashboard includes every available metric, it must be transparent. It isn’t. A client who sees traffic, impressions, clicks, sessions, rankings, followers, engagement, conversions, assisted conversions, and several versions of return on ad spend still may not know which number should guide next month’s budget.
That confusion creates a predictable outcome. Stakeholders either focus on the most flattering metric or distrust the entire report. In both cases, the reporting team loses authority.
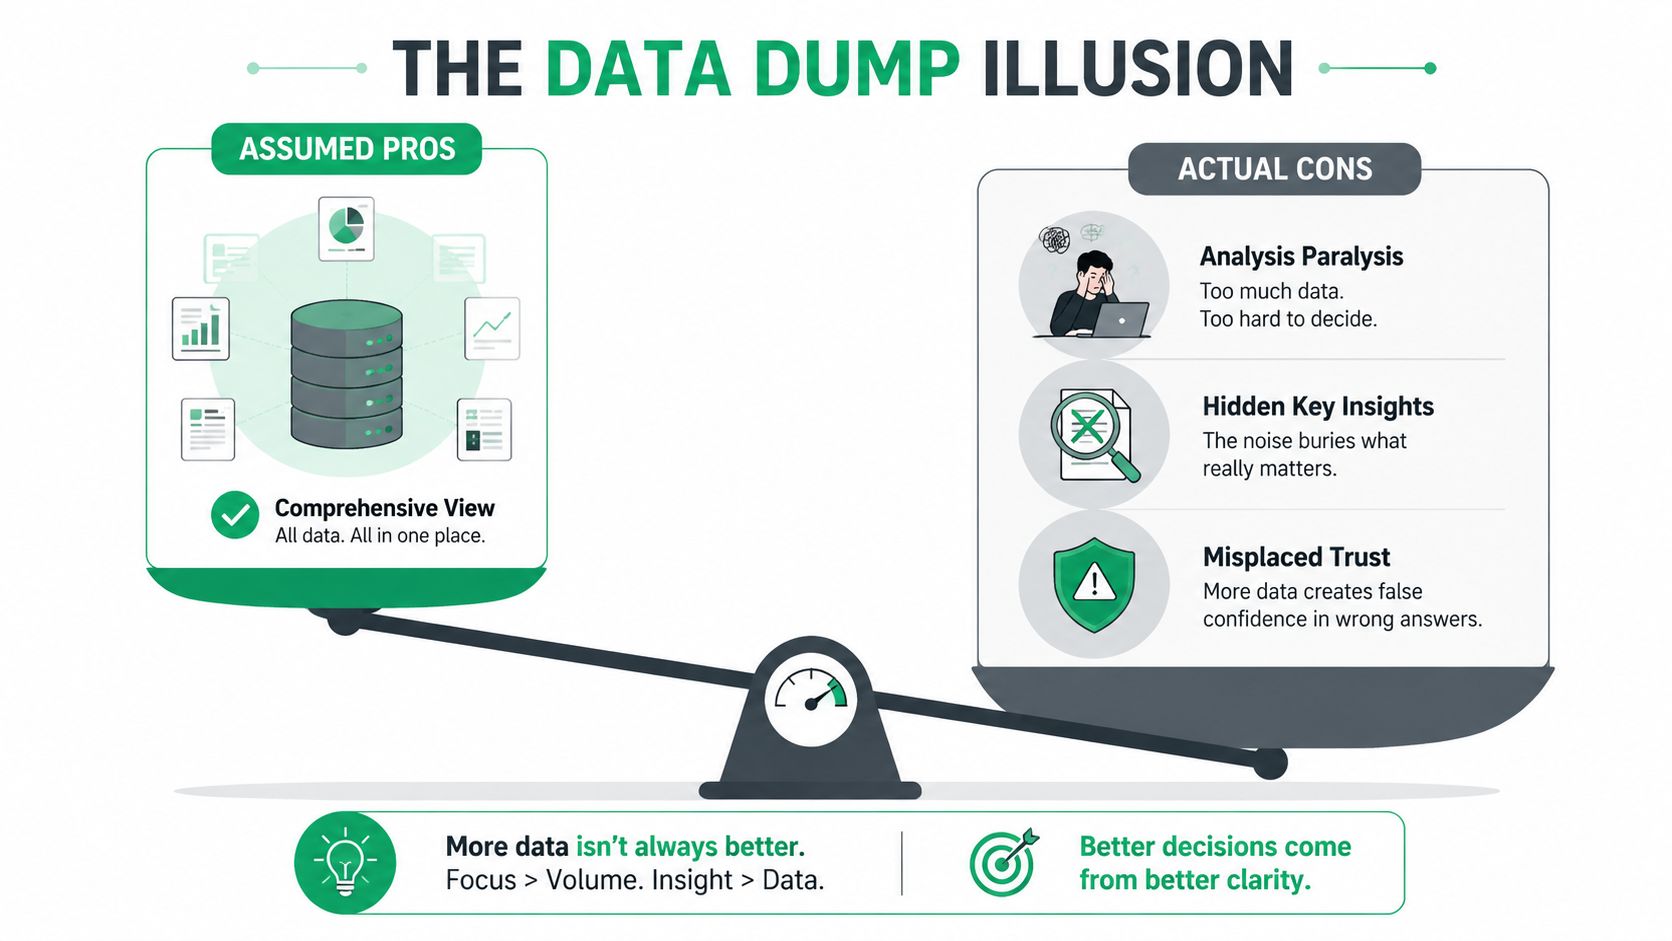
The three failures behind the crowded dashboard
Across reporting rebuilds, three failure modes appear repeatedly:
- Vanity metric inflation: Teams add metrics because they look positive, not because someone makes a decision with them. Impressions can show distribution, but they don’t establish commercial value. Follower counts can indicate audience scale, but they rarely explain pipeline quality on their own.
- Attribution ambiguity: A conversion may appear in several platforms because each system applies a different attribution rule. Without a documented model, stakeholders mistake competing claims for additional revenue.
- Stale pipelines: A report can be technically accurate and still strategically misleading if the source data is delayed, incomplete, or disconnected from the period being discussed.
A stacked bar chart can clarify composition when the categories are defined and the time period is consistent. It can also hide a problem when too many segments compete for attention. The guide to stacked bar charts is useful for understanding the visualization choice, but the governance question comes first: what decision should this chart support?
Practical rule: Every metric needs an owner, a definition, a source, a refresh expectation, and a decision attached to it.
Transparent Reporting: Transparency creates exposure without controls
Transparency increases accountability, which is valuable. It also exposes gaps that teams may not be prepared to explain. An unvalidated customer-level export can create privacy risk. An unexplained change in conversion tracking can trigger a commercial dispute. A dashboard that gives every user unrestricted access can encourage people to treat preliminary figures as final.
The fix isn’t to hide the data. It’s to build controls around it. Transparent reporting works when the organization can trace a number backward, explain its limitations, and act on what it reveals. More disclosure without that infrastructure creates liability, not trust.
What Transparent Reporting Requires
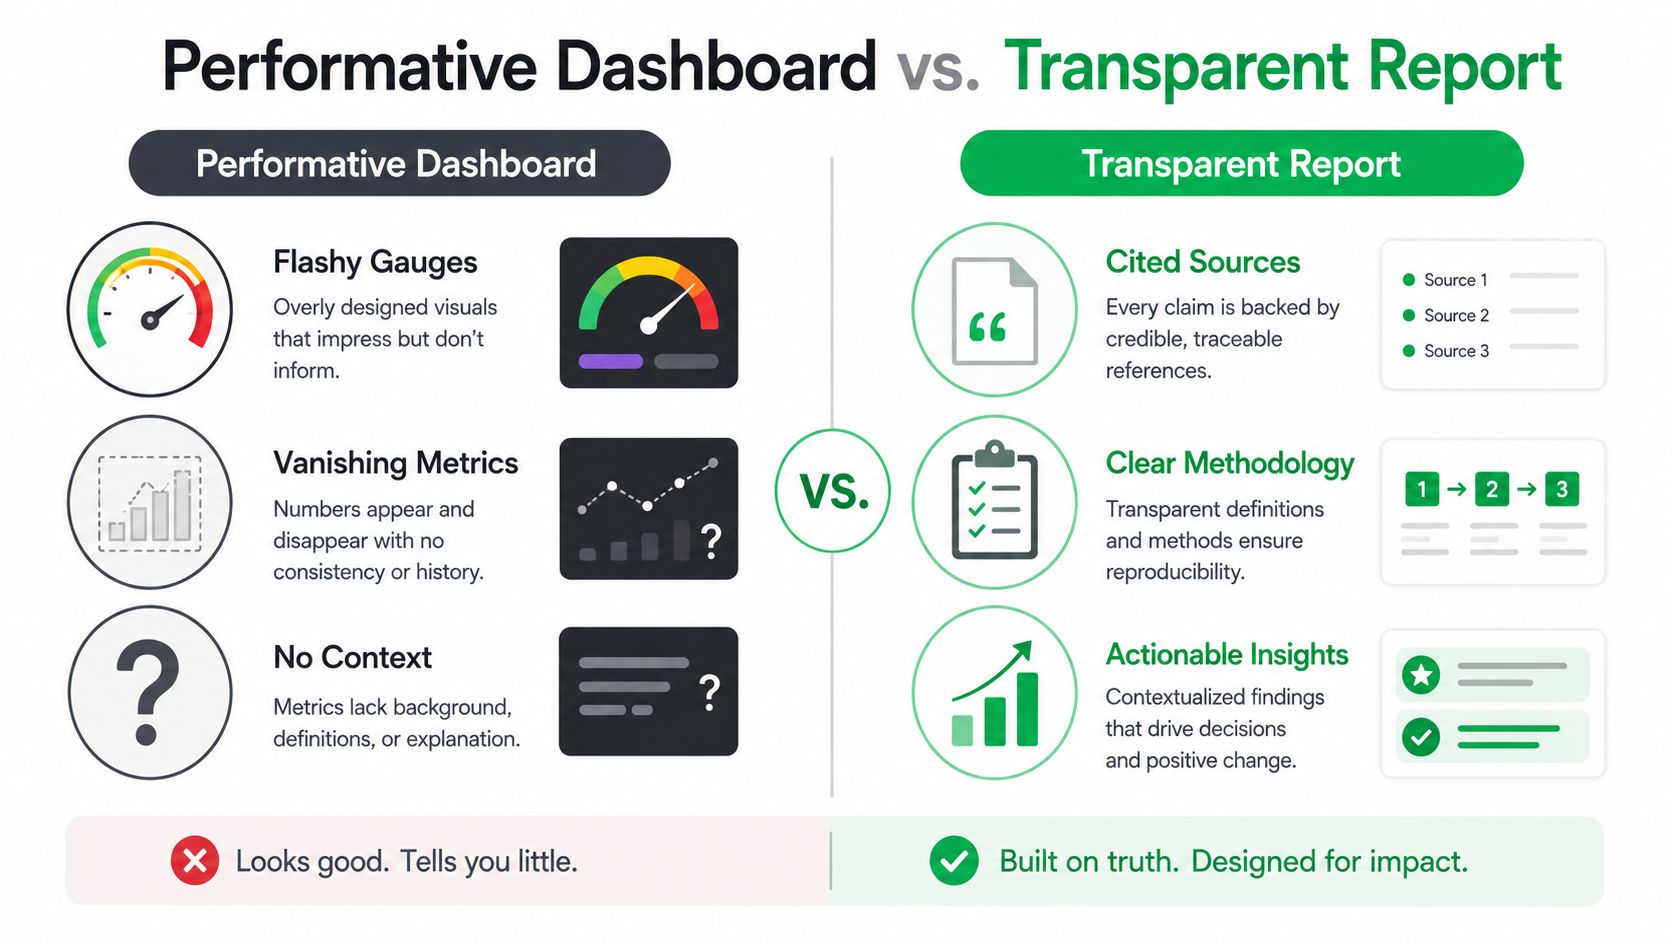
Transparent reporting gives readers enough evidence to test a result themselves. That evidence includes how the organization collected, transformed, filtered, and interpreted the data. Without that trail, a dashboard is a presentation layer rather than a defensible record.
A workable reporting system connects four practices: data lineage, methodology disclosure, context, and actionability. Each creates operating work. Someone must maintain definitions, approve changes, document exceptions, and resolve disagreements before a number reaches decision-makers. Automation reduces repetitive assembly, while customization preserves the business context that templates often miss. The trade-off must be explicit.
Transparent Reporting: Start with the number’s history
Data lineage answers a basic question: where did this number come from? A trustworthy report names the source system, extraction date, transformation rules, filters, and known gaps. If a lead count comes from a CRM, the report should state whether it includes duplicate contacts, test submissions, spam, and offline imports.
Methodology disclosure covers the choices that shape interpretation. For a campaign, document the attribution model, audience definition, conversion event, exclusion criteria, and tracking changes during the reporting period. Quantitative research guidance also calls for hypotheses, study design, collection procedures, inclusion and exclusion criteria, analyses, deviations from preregistered plans, and significant, non-significant, and exploratory findings, as outlined in Keele’s transparent reporting guidance.
Transparent Reporting: Context turns reporting into judgment
“CTR increased” is incomplete, even when the calculation is correct. A transparent report identifies the campaign change, audience shift, comparison period, denominator, and measurement limits. If an agency changed creative and targeting at the same time, the report should not assign the result to one variable without supporting evidence.
Context also includes seasonality, baseline performance, tracking changes, and relevant business conditions. A decline may reflect a measurement break or a deliberate quality trade-off. An improvement may disappear once the underlying conditions change.
The analytics and reporting resource frames reporting as a recurring management process rather than a monthly screenshot. That process needs owners and review points, or documentation becomes outdated as platforms, definitions, and workflows change.
Actionability includes bad news
A report earns trust when it specifies what the team will do next. That could mean reallocating budget, fixing tracking, pausing an audience, changing a landing page, or gathering better data before deciding.
Research reporting standards from eLife recommend enough detail to replicate work, a clear processing pipeline, identified measurements and units of analysis for each statistical test, and effect sizes with 95% confidence intervals where possible, rather than p-values alone. The business lesson is direct: a result without its measurement conditions is not ready for confident action. Disclosure must show both the finding and the controls needed to interpret it safely.
Transparent Reporting: The Metrics That Matter for Business Growth
A growth report should begin with business objectives, not available platform fields. The right question is, “What decision will this metric change?” If the answer is unclear, the metric probably belongs in a diagnostic view, not the executive summary.
For acquisition, focus on the relationship between investment and qualified demand. CAC payback period helps leadership understand how quickly acquisition spending returns through gross profit or contribution margin. Qualified lead velocity shows whether the sales pipeline is expanding with leads that meet agreed criteria. Channel-specific ROAS can guide budget allocation, but last-click attribution can over-credit the final interaction and understate earlier demand creation.
Retention requires a different lens. Cohort-based LTV is more useful than an account-wide average because it reveals whether newer customer groups behave differently. Churn predictors may include product usage, support activity, renewal timing, or engagement depth. Open rates can support email diagnostics, but they shouldn’t stand in for customer value or retention health.
Revenue attribution becomes more complicated as buying journeys include search, paid media, email, sales contact, referrals, and direct visits. Multi-touch models can distribute credit, but every model includes assumptions. A transparent report labels those assumptions and uses proxy metrics when revenue data can’t be connected reliably.
| Business Objective | Primary Metric | Supporting Indicators | Vanity Traps to Avoid |
|---|---|---|---|
| Acquisition efficiency | CAC payback period | Qualified lead velocity, channel ROAS, conversion quality | Impressions and clicks without qualification |
| Retention health | Cohort-based LTV | Churn predictors, renewal behavior, engagement depth | Open rates in isolation |
| Revenue attribution | Revenue by agreed attribution model | Assisted interactions, sales influence, pipeline stage movement | Treating last-click credit as total causation |
| Operational performance | Delivery against defined service or campaign goals | Data freshness, issue resolution, test status | Dashboard activity without a decision |
The campaign effectiveness measurement guide is a useful reference for connecting campaign metrics to outcomes instead of reporting activity for its own sake.
Remove metrics deliberately
Impressions, follower counts, and bounce rate aren’t useless. They become misleading when teams present them as proof of growth without explaining their role. Keep them when they help diagnose reach, audience development, or user experience. Move them out of the main view when they only consume attention.
A simple audit helps. For each metric, record the decision it informs, the person responsible, the source, the definition, and the consequence of a negative result. Metrics that fail that test should be removed, demoted, or clearly labeled as context.
Transparent Reporting: Choosing the Right Reporting Cadence and Format
Reporting cadence should follow the client’s decision rhythm, not the agency’s software settings. A paid media manager may need frequent monitoring for budget and tracking issues, while an executive team may need a concise monthly interpretation. Giving both groups the same report creates either noise or delay.
Daily dashboards often create false urgency for small and medium-sized businesses. Normal variation can look like a crisis when users check a live number without a sufficient comparison period. Weekly reporting can work for active campaigns, but it still needs annotations for launches, budget changes, outages, and incomplete data.
Match the format to the work
| Approach | Best For | Operational Cost | Key Risk |
|---|---|---|---|
| Daily live dashboard | Active monitoring and technical alerts | Low marginal cost after setup, higher setup and maintenance burden | False urgency and misinterpretation |
| Weekly summary | Campaign optimization and short-cycle decisions | Moderate recurring effort | Teams overreact to limited context |
| Monthly narrative report | Budget reviews and strategic planning | Moderate to high editorial effort | Problems may remain unnoticed between reports |
| Quarterly review | Direction, positioning, and resource allocation | High preparation effort, low frequency | Underperformance can persist too long |
| Hybrid dashboard and summary | Clients needing access plus interpretation | Higher initial design effort | Conflicting versions if definitions aren’t governed |
Live tools such as Looker Studio and Power BI provide convenient access, but convenience isn’t interpretation. A curated view can protect the main story while preserving access to supporting detail. Static PDFs force narrative discipline, although they can feel outdated if the underlying data changes soon after delivery.
The SEO monthly reporting format guide offers a practical foundation for recurring search performance reviews, especially when the report must explain movement rather than merely display it.
Transparent Reporting: Scale customization without flattening the relationship
Custom reporting builds trust because it reflects the client’s actual decisions. It also consumes senior time and becomes difficult to maintain across a large portfolio. Templates improve consistency and production speed, but generic commentary tells clients that the agency is reporting a process rather than managing an outcome.
A workable compromise is segmentation. Give strategic accounts a hybrid model with a live dashboard, customized annotations, and a recurring review. Use a structured monthly report for accounts with simpler needs. Reserve deeper custom analysis for major changes, underperformance, or decisions that justify the effort.
Access should also be tiered. Executives need a decision view, channel owners need diagnostic detail, and analysts need source-level data. Full access isn’t automatically more transparent if users can’t distinguish provisional figures from approved results.
Real Implementation Stories and Lessons Learned
The failure point is usually not the data. It’s the governance around interpretation, access, and follow-up.
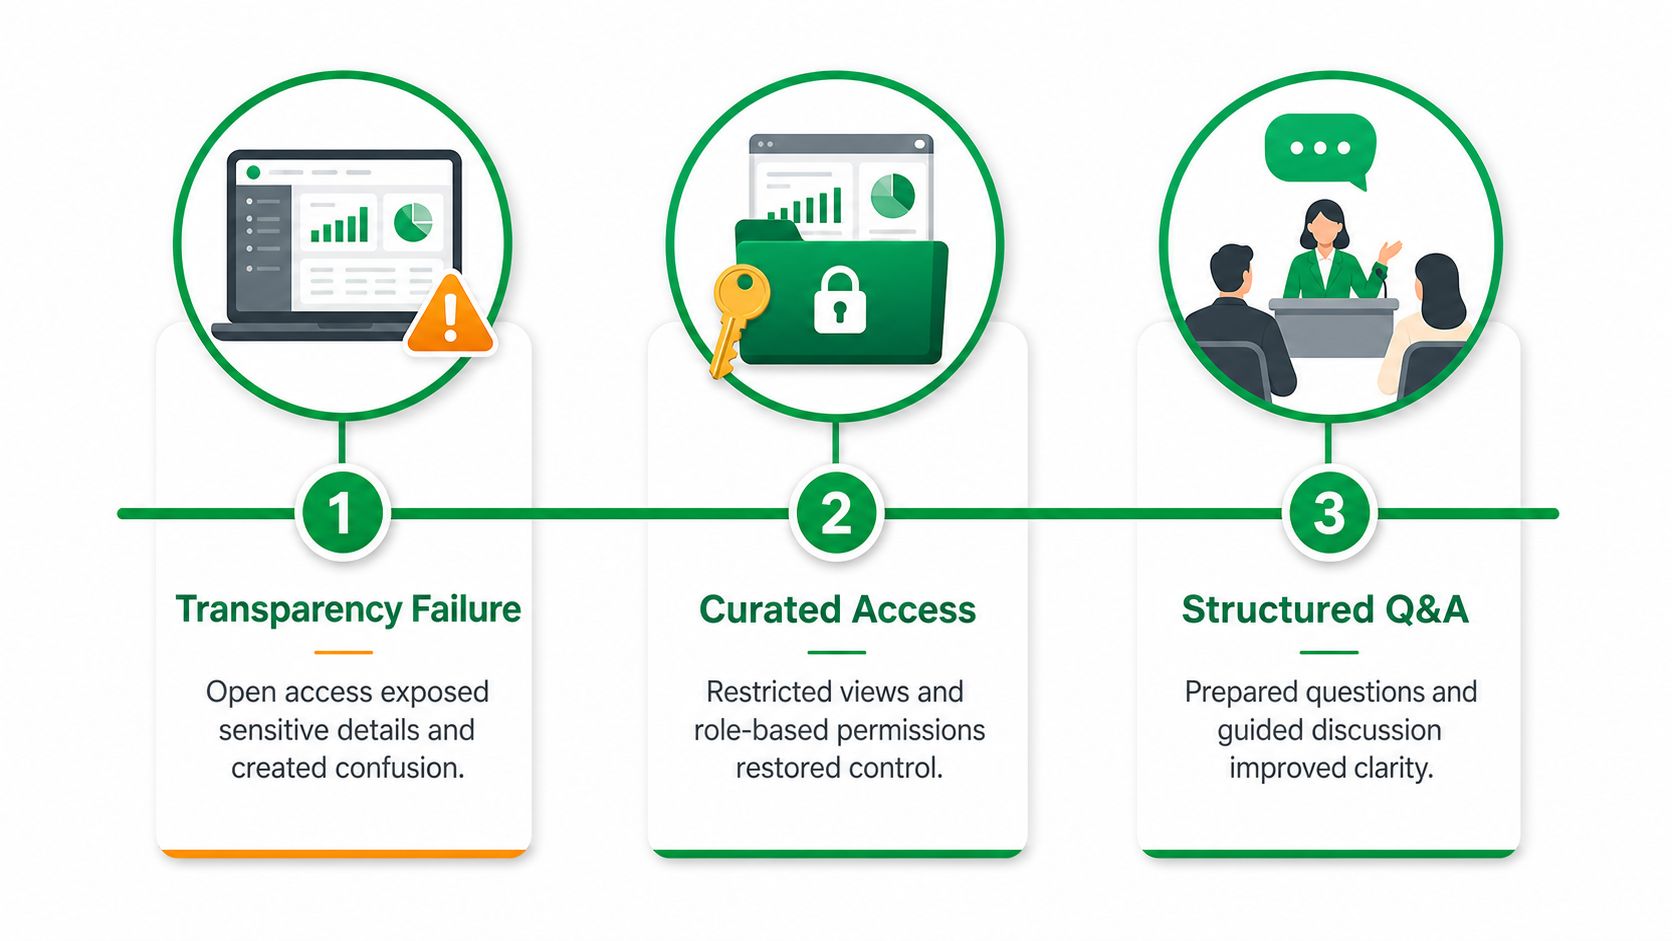
A mid-size agency once gave every client unrestricted dashboard access. The agency believed openness would reduce questions, but clients began escalating normal fluctuations because the dashboard provided figures without annotations or definitions. The team fixed the problem by introducing tiered access, adding contextual notes to major changes, and reserving raw diagnostic views for users who understood the underlying systems.
The lesson was uncomfortable: unrestricted access had increased visibility while reducing understanding.
Transparent Reporting: Automation can’t replace interpretation
An SMB invested in automated reporting and expected better visibility to improve retention. The reports arrived consistently, but they contained performance summaries without recommendations. The client could see what changed and still didn’t know what to do.
The agency added a short monthly video walkthrough. The format made room for three practical questions: what changed, why it likely changed, and what the team would test next. The reporting system became useful because a person connected measurement to action.
Automation had solved delivery. It hadn’t solved judgment.
Sophistication must match client expectations
Another agency standardized on monthly PDF reports. The format was efficient and disciplined, but a major client wanted real-time visibility into active campaigns. The agency responded with a hybrid model: a live dashboard for the top-tier account, supported by a recurring strategic summary that explained the business implications.
The marketing case study resource can help teams distinguish between a report that documents work and a case study that explains a causal business story. They serve different purposes and shouldn’t be treated as interchangeable.
Three practical lessons emerged:
- Curate access: Visibility should reflect user capability and decision responsibility.
- Schedule interpretation: Automated delivery needs a human review when context affects action.
- Price sophistication clearly: Real-time dashboards, custom data models, and customized analysis require ongoing operational investment.
Transparent reporting is a system, not a promise. If nobody owns the definitions, annotations, questions, and escalation path, the dashboard will eventually become a source of friction.
Transparent Reporting: Building Governance That Makes Transparency Sustainable
Transparent reporting without governance infrastructure creates liability. The organization may disclose more while making it harder for stakeholders to determine which figures are reliable, comparable, or actionable.
Corporate transparency research supports this distinction. Transparency International’s review of the 124 largest publicly traded companies found an average transparency score of 3.8 out of 10, while the companies’ combined market value exceeded US$14 trillion. The review also found that 90 of 124 companies did not disclose taxes paid in foreign countries and 54 provided no information on revenues earned abroad, showing why disclosure quality depends on consistency and comparability, not volume alone. These figures come from the Transparency International corporate reporting review.
Build the base before exposing the output
The EU Pay Transparency Directive illustrates the operational risk. Employers must publish overall and median pay gaps, variable pay gaps, quartile distributions, and gaps by worker category. A joint pay assessment must be triggered when an unjustified gap of 5% or more persists, according to Debevoise’s analysis of the directive.
The governance lesson applies directly to marketing. If compensation or campaign data comes from inconsistent systems, publishing more fields doesn’t resolve the underlying conflict. It documents the conflict at scale.
A sustainable reporting program needs:
- A shared metric glossary: Define terms such as qualified lead, conversion, revenue, assisted conversion, and active customer.
- Source validation: Check extraction dates, connector health, filters, duplicate handling, and missing fields.
- Approval workflows: Assign a reviewer before client delivery, especially when figures affect budgets or contractual commitments.
- Escalation paths: Specify who investigates tracking breaks, underperforming campaigns, and unexplained variance.
- Recurring audits: Review definitions, source logic, permissions, and report accuracy on a scheduled basis.
Transparent Reporting: Protect privacy and defensibility
Marketing reports may include customer-level information. Teams must review whether the data is necessary, whether access is appropriate, and whether privacy obligations under frameworks such as GDPR or CCPA apply. Contract terms also matter when a client expects performance guarantees, attribution certainty, or service-level reporting.
The OECD’s guidance recommends granular, time-bounded metrics, including counts of requests by type and the number of users, accounts, URLs, or identifiers affected. It also identifies relevance, reliability, comparability, understandability, and timeliness as important dimensions of transparency quality in corporate reporting. The OECD transparency reporting guidance reinforces the operational standard: reports should be structured for comparison and assurance, not merely written to sound reassuring.
Transparency isn’t oversharing. It’s giving the right audience enough verified context to make a responsible decision.
Your Transparent Reporting Implementation Checklist
The safest implementation is phased. Trying to rebuild every connector, dashboard, definition, and client workflow at once usually overwhelms the team and creates a new set of inconsistencies.
First 30 days
Start with the existing reporting estate.
- Audit dashboards, owner: reporting lead, effort: focused review, success indicator: redundant and vanity metrics identified.
- Create a single source-of-truth register, owner: data or operations lead, effort: focused setup, success indicator: every core metric has a named source.
- Document critical definitions, owner: account director, effort: working session, success indicator: client-facing terms no longer vary by report.
- Check access permissions, owner: systems administrator, effort: focused review, success indicator: users see only the data appropriate to their role.
Don’t wait for perfect documentation. Capture the current method, identify uncertainty, and assign someone to resolve it.
Days 30 through 90
Build repeatability rather than adding visual polish.
- Publish a reporting glossary, owner: operations lead, effort: moderate build, success indicator: teams use one approved definition per metric.
- Add data freshness and exception checks, owner: analytics lead, effort: moderate build, success indicator: stale or incomplete inputs are flagged before delivery.
- Create an approval workflow, owner: account director, effort: moderate process design, success indicator: reports receive documented review before clients see them.
- Add a recommendation layer, owner: strategist, effort: recurring editorial work, success indicator: each major movement has an owner and next action.
Beyond 90 days
Invest in infrastructure only after the basics hold.
- Anomaly detection, owner: analytics team, success indicator: unusual movement receives timely investigation.
- Client self-service views, owner: product or operations lead, success indicator: clients can answer routine questions without bypassing governance.
- Compliance reviews, owner: legal or privacy lead, success indicator: data use, retention, access, and contractual promises are documented.
- Audit-ready lineage, owner: data engineering or analytics lead, success indicator: teams can trace key outputs from source to report.
Build or buy
| Decision | Build When | Buy When | Watch Closely |
|---|---|---|---|
| Custom data model | Definitions and workflows are highly specialized | Common connectors and standard metrics are sufficient | Maintenance ownership |
| Automated dashboard | Stakeholders need recurring access | A trusted platform already supports the required sources | Permission design |
| Client portal | Self-service is central to account delivery | A secure reporting product meets access needs | Privacy and support burden |
| Manual narrative layer | Business context changes frequently | Commentary is standardized and low risk | Editorial consistency |
Review legal commitments at three checkpoints: before collecting customer-level data, before granting new access, and before promising performance or attribution in a contract. A transparent report should never create a privacy obligation or commercial expectation the underlying system can’t support.
The result worth pursuing isn’t a fuller dashboard. It’s a reporting process that people can verify, understand, challenge, and use. That takes less effort when the rollout is staged and the organization treats governance as part of delivery rather than an administrative afterthought.
Mr. Green Marketing, LLC provides strategy-led digital marketing across SEO, PPC, web design, Amazon marketing, branding, social media, and related services, with regular reporting on traffic, leads, conversions, and other agreed KPIs. Request a free audit and performance report by visiting Mr. Green Marketing, LLC to identify visibility gaps and build a clearer path from data to growth.
Leave a Comment
sing in to post your comment or sign-up if you dont have any account.