
How to Calculate Marketing ROI: And we’re back to it. The one number that actually matters: Return on Investment. You’re pouring cash into ads, content, and campaigns, but are you making more money than you’re spending? Answering that is the key to justifying your budget, proving your value, and making smarter calls on where to invest next.
This isn’t about vanity metrics. Nope. It’s about connecting your daily grind directly to the bottom line.
How to Calculate Marketing ROI: The Core Marketing ROI Formula You Need To Know
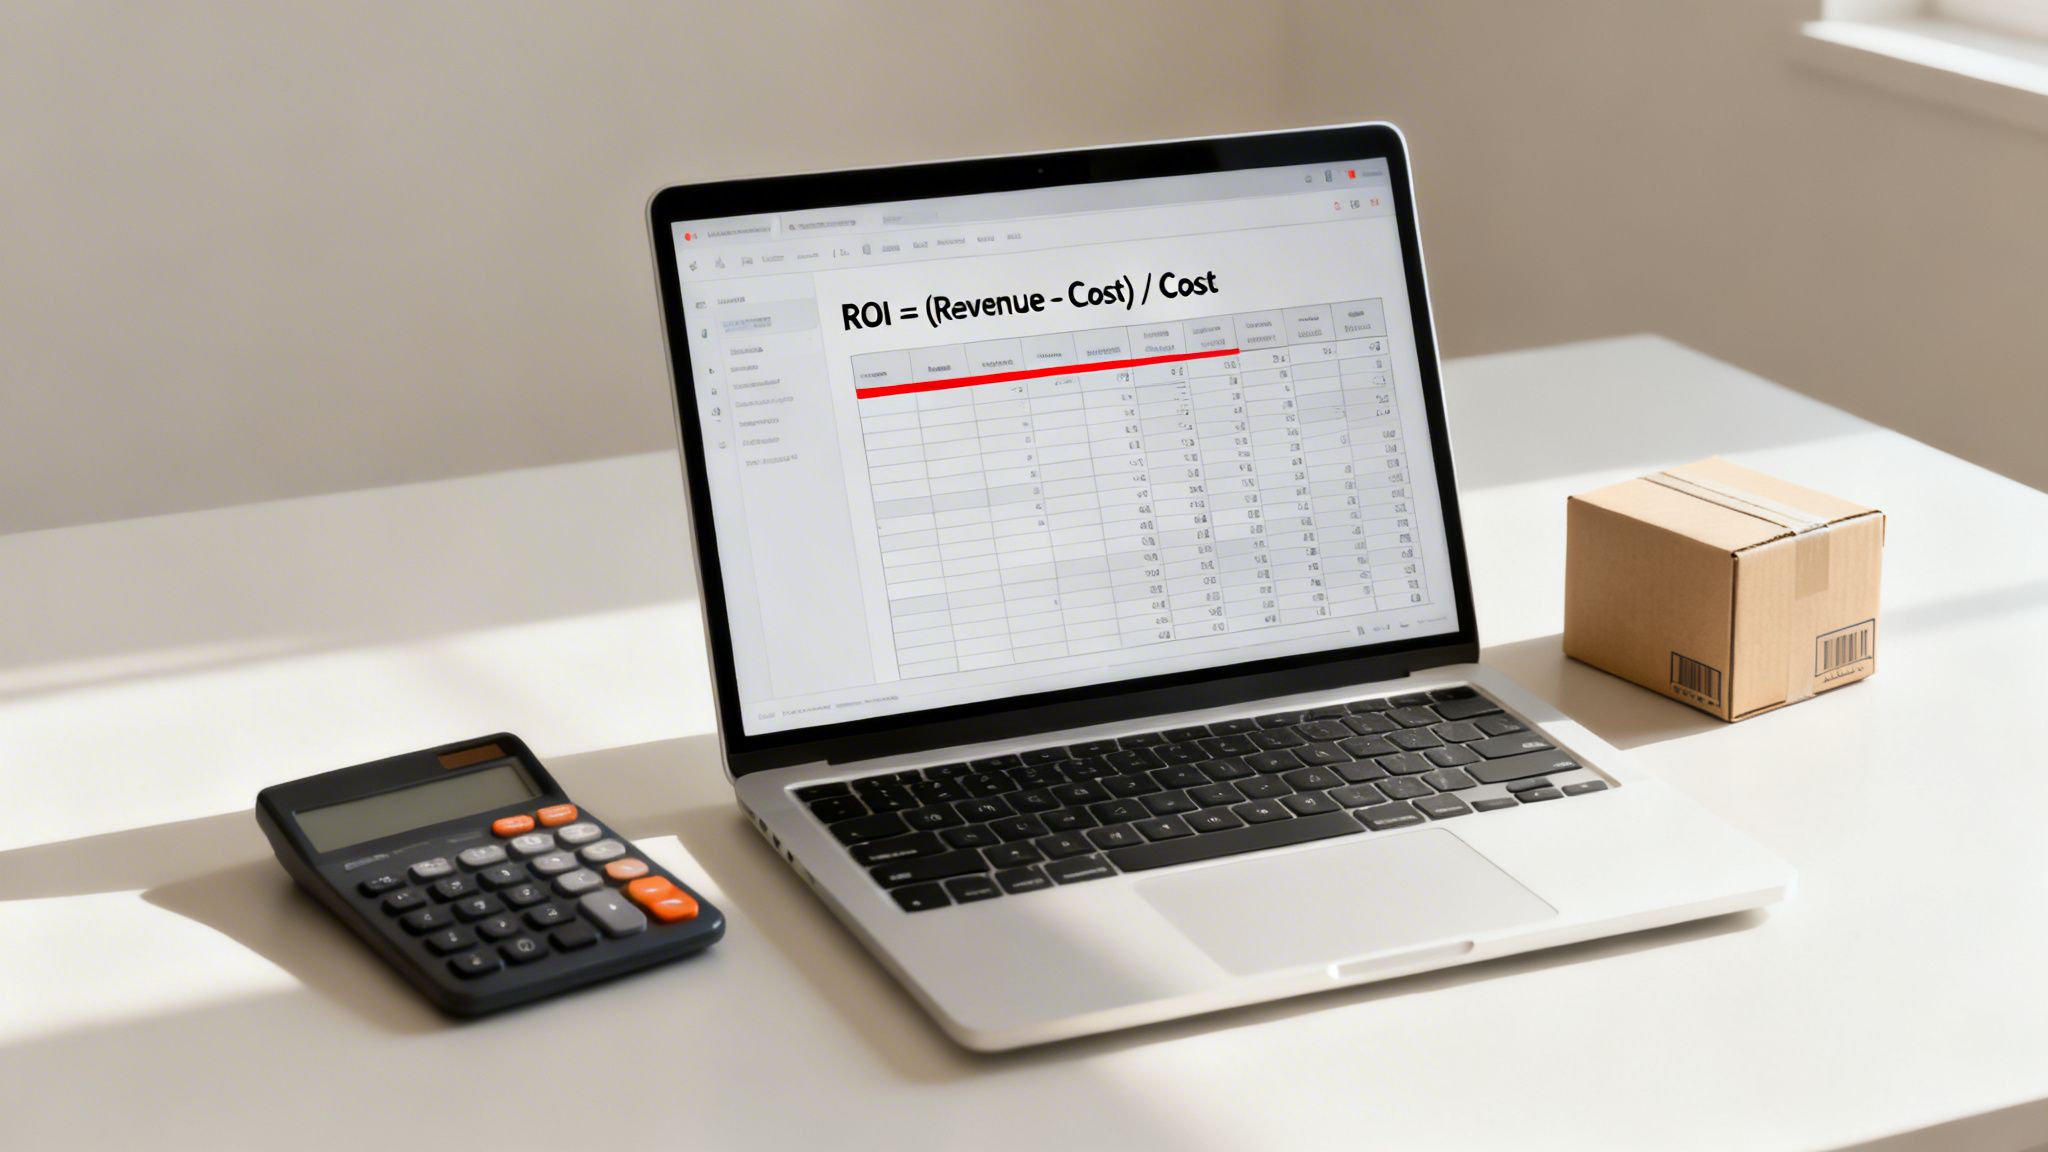
Good news. The basic calculation is surprisingly straightforward. At its heart, marketing ROI is designed to give you a quick, clear look at profitability.
To get a solid handle on the basics, you can dive deeper into calculating marketing ROI, which breaks down the essential formulas and tracking methods you’ll need.
1. How to Calculate Marketing ROI: The Basic ROI Calculation
The simplest way to calculate marketing ROI starts with this proven formula: (Sales Growth – Marketing Cost) / Marketing Cost. Just multiply that result by 100 to get your percentage. Easy.
Let’s use a real-world example. Imagine your e-commerce store invests $1,000 in a Google Ads campaign. Over the next month, that campaign directly generates $5,000 in new sales.
Plugging those numbers into the formula, you get:
($5,000 – $1,000) / $1,000 = 4.0
Multiply that by 100, and you’ve got a 400% ROI. This means for every single dollar you spent, you made $4 back in profit. That’s a metric executives love because it’s clear, powerful, and speaks their language.
But—and this is a big but—it’s not the full picture.
Here’s a quick reference table to see how this simple formula works at a glance.
Basic ROI Calculation At a Glance
| Metric | Value | Notes |
|---|---|---|
| Sales Growth from Campaign | $5,000 | The total revenue directly attributed to your marketing efforts. |
| Marketing Cost | $1,000 | The total amount spent on the campaign. |
| Simple ROI | 400% | Calculated as (($5,000 – $1,000) / $1,000) x 100. |
| Organic Growth (Baseline) | $500 | Your business’s typical growth without this specific campaign. |
| Adjusted (True) ROI | 350% | Calculated as ((($5,000 – $500) – $1,000) / $1,000) x 100. |
This table shows the difference between a simple calculation and a more accurate one. And that adjusted ROI is the number you can confidently stand behind.
2. Factoring In Your Baseline Growth
Here’s where a lot of marketers stop. And frankly, get it wrong. Your business has a natural pulse. You make sales even when you aren’t running a specific campaign, right? That’s your organic growth.
To get a true picture of your campaign’s impact, you have to subtract this baseline. Otherwise, you’re taking credit for sales that would have happened anyway.
Let’s refine our example. Say your store typically grows by 10% month-over-month. If your total sales the previous month were $5,000, your expected organic growth would be $500.
Now, we adjust the formula with the real numbers:
- Total Sales Growth: $5,000
- Organic Growth to Subtract: $500
- True Marketing-Driven Growth: $5,000 – $500 = $4,500
With this adjusted number, your new calculation is: (($4,500 – $1,000) / $1,000) x 100 = 350% ROI.
It’s still a fantastic return, but now it’s an honest one. And that accuracy is what separates amateur analysis from professional strategy. This is the figure you can confidently take to your next meeting, because it proves you understand the nuances of business growth and can isolate the precise value your marketing creates.
How to Calculate Marketing ROI: Measuring ROI Beyond the First Sale with Customer Lifetime Value

So the simple ROI formula is a fantastic starting point. It gives you a clean snapshot of a campaign’s immediate impact. But what happens after that first sale? The customers who come back, subscribe, or refer their friends?
Their value goes far beyond a single transaction.
And this is where Customer Lifetime Value (CLV) completely changes the game. Focusing only on the initial purchase is like judging a movie by its opening scene—you’re missing the whole story. If your business is built on relationships, like a subscription service or an e-commerce store with loyal followers, CLV is your new best friend.
1. The Upgraded ROI Formula With CLV
Instead of just looking at that first sale, we need to bring CLV into the picture. This is how you uncover the true, long-term profitability of your marketing. So the formula gets a serious upgrade:
(Average CLV x New Customers Acquired – Marketing Cost) / Marketing Cost x 100
Let’s say your campaign costs $2,000 and brings in 10 new customers. You’ve done the math and know each new customer has an average CLV of $800. That’s $8,000 in total lifetime value from a single campaign.
The ROI becomes: ($8,000 – $2,000) / $2,000 = 3.0, or a 300% return. You can see how this reframes profitability in the detailed breakdown on how to calculate ROI for marketing on Cometly.com.
A campaign that looked just “okay” with a basic ROI calculation might suddenly reveal itself as a long-term goldmine. And that is how you spot the difference between a one-hit wonder and a sustainable growth engine.
Key Insight: Ignoring CLV can cause you to dramatically undervalue your marketing, especially for service or subscription models. In some cases, a basic ROI formula can understate a campaign’s true return by as much as 50%.
2. How to Calculate CLV Without a Data Science Degree
I know what you’re thinking—this sounds complicated. It doesn’t have to be. You don’t need a team of analysts to get a solid working estimate. A simple, effective way to calculate a basic CLV is:
Average Purchase Value x Average Purchase Frequency x Average Customer Lifespan
Let’s break that down with a real-world example:
- Average Purchase Value: Total Revenue / Number of Orders. How much does a customer spend per order?
- Average Purchase Frequency: Total Orders / Unique Customers. How often do they buy from you in a year?
- Average Customer Lifespan: How long does a customer stick around? For subscription models, this is the average time before they cancel.
Imagine you run a local coffee shop:
- The average spend is $7.
- A loyal customer comes in 3 times a week (156 times a year).
- Your regulars tend to stick around for about 2 years.
The CLV for that customer would be: $7 x 156 x 2 = $2,184. Suddenly, the $10 you spent on a Facebook ad to get them in the door looks like an incredible investment.
3. The Golden Ratio: CLV to CAC
Now for the real magic—comparing your CLV to your Customer Acquisition Cost (CAC). Your CAC is the total you spend on sales and marketing to acquire one new customer.
A healthy business should aim for a CLV:CAC ratio of at least 3:1.
- 1:1 Ratio: You’re spending a dollar to make a dollar. A fast track to going out of business.
- 3:1 Ratio: This is the sweet spot. You have a solid, profitable model for growth.
- 5:1 Ratio or Higher: You’re crushing it. You have room to invest more aggressively in growth while maintaining healthy margins.
This ratio is a critical health check for your business. It stops you from falling into the trap of celebrating new customers without realizing you’re losing money on every single one. And it forces you to ask the right questions and build a business that actually lasts.
How to Calculate Marketing ROI: Untangling ROI in Your Multi-Channel Marketing Mix
Your marketing doesn’t happen in a vacuum. You’re probably running Google Ads, pushing content on social media, optimizing for search, and sending out emails. They all work together—or at least, they should.
So, how do you figure out the ROI of this complex, overlapping mix without getting completely lost in spreadsheets? The temptation is to look at each channel in isolation, but that gives you a fractured, incomplete picture. A true understanding of your marketing ROI requires seeing the entire forest, not just a few trees.
It all starts with getting a bird’s-eye view of your performance.
Calculating Your Blended ROI
Before you can figure out what’s working, you need a baseline. This is your blended ROI, and it’s simpler to calculate than it sounds. You just need to sum up all your marketing costs and all your returns across every single channel.
- Total Marketing Investment: Add up everything you spent. This includes your ad spend on Google and Meta, your SEO agency’s retainer, the cost of your email software, and any freelance content creators you hired.
- Total Attributed Revenue: Sum the revenue generated from all of those marketing efforts.
The formula is the same one we’ve been using, just with bigger numbers: (Total Revenue – Total Investment) / Total Investment x 100.
For instance, if a multi-channel campaign combining Google Ads, Facebook, and SEO had a total spend of $100,000 and generated $450,000 in revenue, your overall ROI is a solid 350%. Globally, SMBs using multi-channel strategies have seen their average ROI climb to 310%, a significant jump from single-channel efforts.
This blended number is a powerful top-line metric. But it also hides a crucial detail—how do you know which channels contributed the most to that $450,000? This leads us to the trickiest part of the puzzle: attribution.
The Last-Click Lie and Why It’s Costing You Money
For years, the industry standard was last-click attribution. It’s simple, clean, and easy to track. And the model gives 100% of the credit for a sale to the very last touchpoint a customer had before converting. If they clicked a Google Ad and then bought something, Google Ads gets all the glory.
And this is where things get messy—and frankly, misleading.
That model completely ignores the customer’s actual journey. What about the blog post they read a week ago that first introduced them to your brand? Or the Facebook ad they saw yesterday that reminded them you exist? Last-click gives those crucial, trust-building interactions zero credit. Zilch.
The reality is that relying solely on last-click can skew your understanding of channel performance by as much as 30%. You might end up cutting the budget for a top-of-funnel channel like SEO or social media because it doesn’t look like it’s converting, when in reality, it’s feeding all your other channels.
If you’re running paid search, this is an especially important concept to grasp. We created a guide to PPC marketing demystified for beginners that dives deeper into how these campaigns fit into the bigger picture.
Choosing an Attribution Model That Tells the Whole Story
To get a more accurate picture, you need to look at multi-touch attribution models. These models distribute credit across various touchpoints, giving you a more holistic view of what’s actually working. For anyone serious about untangling cross-channel marketing attribution, moving beyond last-click is the first and most important step.
Choosing the right model helps you assign value more accurately across the entire customer journey. Here’s a quick comparison of the most common ones.
Comparing Common Attribution Models
| Attribution Model | How It Works | Best For |
|---|---|---|
| Last-Click | Gives 100% of the credit to the final touchpoint before conversion. | Short sales cycles where customers convert immediately. Often misleading. |
| First-Click | Gives 100% of the credit to the very first touchpoint a customer had. | Businesses focused purely on lead generation and brand awareness. |
| Linear | Distributes credit equally across every touchpoint in the customer’s journey. | Companies that value every interaction and want a balanced, simple view. |
| Time-Decay | Gives more credit to touchpoints closer to the time of conversion. | Longer sales cycles where recent interactions have more influence. |
| Position-Based (U-Shaped) | Assigns 40% credit to the first touch, 40% to the last touch, and the remaining 20% is split among the middle touches. | Valuing both the initial introduction and the final conversion driver. |
My personal favorite for many businesses is the Position-Based (U-Shaped) model. It properly values the channel that first brought a customer to you and the one that ultimately sealed the deal.
Ultimately, choosing the right model depends on your business goals and sales cycle. But moving beyond last-click is non-negotiable if you want to make smart, data-driven decisions about your budget. It’s how you finally connect the dots and see how your marketing machine is truly working as one cohesive unit.
How to Calculate Marketing ROI: Finding the Hidden Costs That Sink Your ROI
So your marketing ROI calculation is only as good as the numbers you feed it. I see this all the time—marketers track their ad spend, ignore everything else, and walk away with a dangerously inflated ROI figure.
It’s an easy trap to fall into. You get an invoice from Google or Meta, plug it into a spreadsheet, and get a feel-good number. But what about the other costs? The freelance designer who created the ad? The portion of your marketing manager’s salary? These are real expenses that silently eat away at your true profitability.
Ignoring these costs is the fastest way to make terrible budget decisions. You might be celebrating a “wildly profitable” campaign that’s actually losing you money. Getting this right is what separates a vanity metric from an actionable number you can confidently take to your boss.
How to Calculate Marketing ROI: Beyond the Ad Spend Invoice
So, what are these sneaky expenses that can turn a “winning” campaign into a dud? It’s not just about the ads—it’s the entire ecosystem of resources that bring your marketing to life.
Here’s a real-world cost checklist. Things to track:
- Team Salaries and Time: This is the big one most people miss. If your marketing specialist spends 25% of their time managing a campaign, then 25% of their salary for that period is a direct cost.
- Agency and Freelancer Fees: That monthly retainer you pay your PPC agency is a campaign cost. So is that one-off payment to a copywriter for your landing page or a designer for your ad creative.
- Software and Tool Subscriptions: Your marketing stack has a price tag. You need to account for your share of costs for tools like Mailchimp, HubSpot, Ahrefs, and Canva.
- Content Creation Costs: Did you shoot a product video? The fees for the videographer, editor, and any equipment rentals are all part of your investment. This applies to blog posts, case studies, or any asset you build for a campaign.
Think of it this way: If a cost would disappear if the campaign didn’t exist, it absolutely needs to be included in your ROI calculation. It’s about building a bulletproof tracking system that reflects financial reality, not just the highlights.
Putting It Into Practice: A Real-World Example
Let’s see how this plays out and completely changes the story.
Imagine you spent $2,000 on Facebook ads and generated $10,000 in sales. A quick, surface-level calculation gives you a fantastic 400% ROI. Time to celebrate, right? Not so fast.
Now, let’s factor in the real-world costs you were diligently tracking:
- Ad Spend: $2,000
- Freelance Designer (for ad creative): $500
- Portion of Marketing Manager’s Salary (time spent on campaign): $800
- Share of Software Costs (email/CRM): $100
Your True Marketing Investment wasn’t $2,000. It’s actually $3,400.
Suddenly, the math looks very different:
($10,000 – $3,400) / $3,400 = 1.94
Your actual ROI is 194%. It’s still a solid return, but it’s less than half of what you initially thought. This honest number gives you a real baseline for improvement. And this is precisely the kind of detailed analysis we perform as part of our digital marketing audit services to uncover hidden drains on profitability.
This disciplined approach to cost-tracking is what separates the marketers who think they’re winning from those who actually are.
How to Calculate Marketing ROI: A Practical Walkthrough for Calculating Campaign ROI
Theory is one thing, but let’s get our hands dirty. It’s time to move from formulas on a whiteboard to a real-world, end-to-end example of calculating marketing ROI. We’ll show you exactly how we do it, so you can adapt this blueprint for your own campaigns.
We’ll walk through a complete example for “Cozy Threads,” a fictional e-commerce store selling handmade blankets. We’ll define a goal, track every cost, and attribute the revenue—showing you exactly where to find the data you need.
1. Setting Up for a Successful Measurement
Before you spend a single dollar, you need a plan. And accurate ROI calculation starts with good data hygiene. You simply can’t track what you haven’t set up.
For Cozy Threads, the goal is straightforward: drive sales for a new product line of weighted blankets through a targeted Facebook and Instagram ad campaign.
The key is setting up your tracking before the campaign launches. For this, two pieces are non-negotiable:
- The Meta Pixel: This snippet of code on your website is essential for e-commerce. It tracks what users do after clicking your ad, like adding an item to their cart or completing a purchase.
- UTM Parameters: These are tags added to your ad’s destination URL. They tell tools like Google Analytics exactly where your traffic came from. Our ad’s URL will include tags for
utm_source=facebook,utm_medium=cpc, andutm_campaign=weighted_blanket_launch.
This setup is the foundation. It ensures both Meta and Google Analytics can “see” the sales generated by our ads, which is critical for accurate attribution.
2. Tracking Every Penny of Your Investment
This is where most businesses get it wrong. The real cost of a campaign is almost never just the ad budget. For Cozy Threads’ one-month campaign, let’s tally up the full investment.
Here are all the costs we need to include for a true calculation:
- Direct Ad Spend: $1,500 allocated for the Facebook and Instagram campaign.
- Creative Production: We paid a freelance photographer $300 for lifestyle shots of the new blankets.
- Team Time: The marketing manager spent about 10 hours on this campaign (setup, monitoring, reporting). At an internal rate of $50/hour, that’s $500 in salary cost.
- Software Costs: A small portion of the e-commerce platform and analytics tool subscriptions, which we’ll estimate at $50 for the month.
It’s easy to forget these “hidden” costs, but they are crucial for an accurate ROI figure.
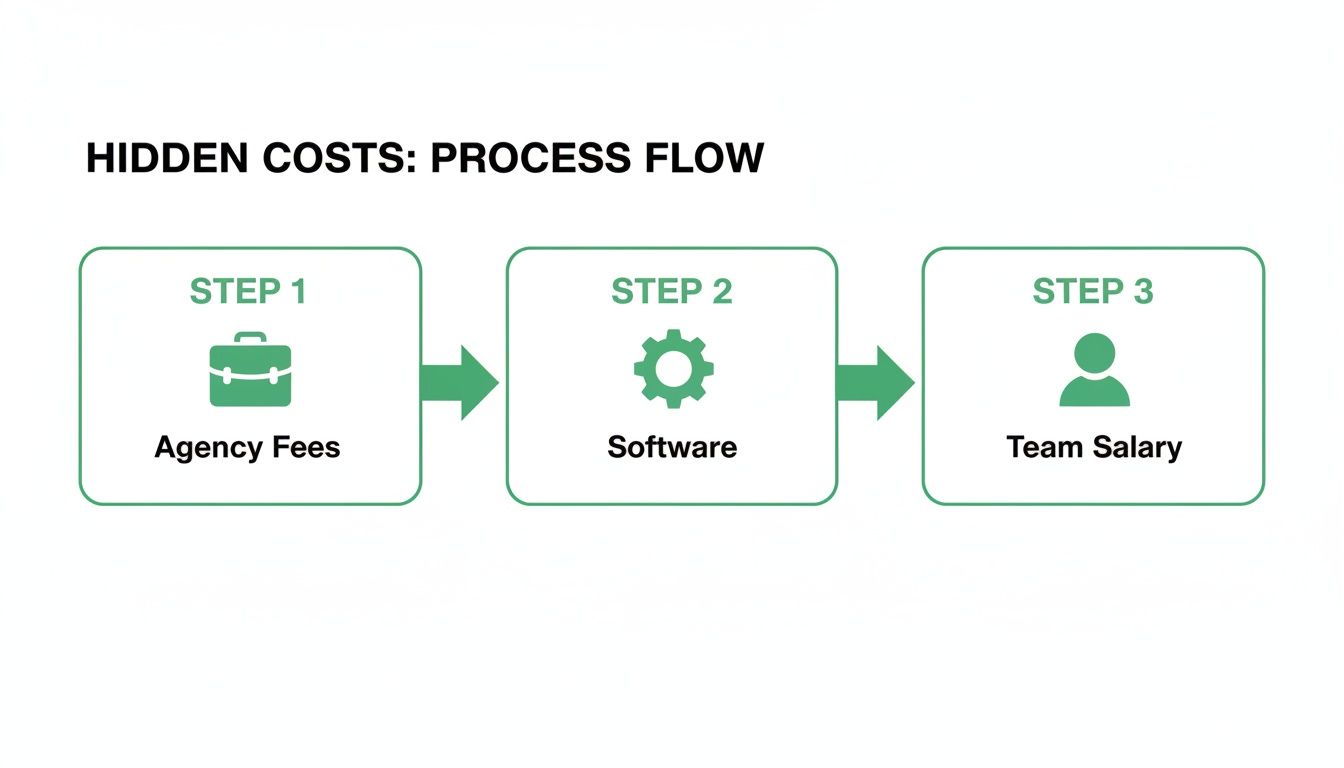
As you can see, costs quickly extend beyond ad spend to include things like agency fees, software, and internal team salaries. By including these, our Total Marketing Investment for the campaign is not $1,500, but $2,350. This is the real number we need to use.
3. Finding Your Revenue in Google Analytics
After the month-long campaign, it’s time to find our return. Thanks to our UTM parameters, this part is pretty simple. We’ll head straight to Google Analytics.
By navigating to Acquisition > Traffic acquisition and filtering for our campaign name (weighted_blanket_launch), the report gives us the exact data we need. We can see that the campaign drove a total of $7,200 in revenue.
This is the moment of truth. We now have our two key numbers: a Total Marketing Investment of $2,350 and a Total Attributed Revenue of $7,200.
4. Plugging It All Into the Formula
Now for the easy part—the math. We’ll use our classic ROI formula:
(Revenue – Investment) / Investment x 100
Let’s plug in Cozy Threads’ numbers:
- ROI = ($7,200 – $2,350) / $2,350
- ROI = $4,850 / $2,350 = 2.06
Multiply by 100, and we get a 206% ROI. For every $1 invested, Cozy Threads generated $2.06 in profit after accounting for all marketing costs. This is a solid, defensible number you can take to the bank and use to make smart decisions.
This practical walkthrough—from setup to calculation—is the core process for figuring out your marketing ROI. It replaces guesswork with clarity and empowers you to prove what’s working. For more details on using these results, you might be interested in our guide on how to measure marketing campaign effectiveness.
Common Questions About Marketing ROI
After you’ve run the numbers, tracked your costs, and wrestled with attribution models, the real questions start to bubble up. This is where the theory of marketing ROI meets the messy reality of running a business—and frankly, it’s the most interesting part. Let’s dig into some of the most common questions we hear from clients.
What Is a Good Marketing ROI?
The honest answer? It depends. And that’s not a cop-out.
A “good” ROI is completely different depending on your industry, the channel you’re using, and—this is the big one—your own profit margins. Many businesses aim for a 5:1 ratio as a solid benchmark, meaning they make $5 in revenue for every $1 spent. If you’re hitting a 10:1 ratio or better, you’re doing exceptionally well.
But context is everything.
- For Low-Margin Businesses: If you’re selling products with tight margins, a 3:1 ROI might actually be losing you money once you factor in the cost of goods and overhead. You might need a 7:1 ratio just to break even and something much higher to actually fuel growth.
- For High-Margin Businesses: On the flip side, a SaaS company with high margins would be ecstatic with a 3:1 return. That kind of ratio often translates into massive profit and sustainable growth.
The most important benchmark is your own. The goal isn’t just to hit some generic industry number—it’s to consistently improve your ROI over time. That’s how you build a winning strategy.
How Do You Calculate ROI for SEO or Content Marketing?
This is the million-dollar question, isn’t it? Calculating ROI for channels like SEO is definitely trickier than it is for PPC, where the click-to-sale path is so direct. But it’s not impossible; you just need patience and the right framework.
Forget about last-click attribution here—it simply won’t give you an accurate picture. Instead, you need to track your organic performance over a longer period, usually 6-12 months.
Here’s a practical way to approach it:
- Tally Up Your Costs: This is the easy part. Add up everything you’ve invested: content creation fees (writers, designers), SEO tool subscriptions like Ahrefs or Semrush, and any agency or freelancer payments. Let’s say your total investment over six months is $12,000.
- Assign a Value to Conversions: This step is crucial. In Google Analytics, set up a segment to isolate your organic traffic and track the conversions coming from it. If you don’t sell directly from your site, you have to assign a value to each lead. For example, if you know 1 in 10 organic leads becomes a customer with an average lifetime value of $5,000, then each lead is worth $500.
- Do the Math: Let’s imagine your SEO efforts over those six months brought in 40 qualified leads. With each lead valued at $500, your total return is $20,000.
Now, just plug those numbers into the ROI formula:
($20,000 – $12,000) / $12,000 = 67% ROI.
It takes time to see the fruits of your labor with SEO and content, but this is how you prove their incredible long-term value.
How Often Should I Calculate Marketing ROI?
There’s no single right answer here. The right cadence depends entirely on the speed of the marketing channel and your sales cycle. Trying to use a one-size-fits-all schedule will just lead to frustration.
I always recommend a tiered reporting schedule. Think of it this way:
- Daily or Weekly Checks: This is for your fast-moving, high-spend campaigns like paid search and paid social ads. The feedback loop is almost immediate. Checking ROI this often lets you make quick optimizations, like shifting budget away from a losing ad set to a winning one. Not doing so is just leaving money on the table.
- Monthly or Quarterly Reviews: This timing is perfect for the long game. Strategies like SEO, content marketing, and brand-building have a cumulative effect. Trying to measure SEO ROI weekly is a pointless exercise that will only give you a headache from noisy, inconclusive data.
A full, all-channel ROI analysis should be a cornerstone of your quarterly and annual planning meetings. That’s where you zoom out, see the big picture, and make the strategic moves that define your future.
Understanding how to calculate marketing ROI is step one, but applying it consistently is what truly drives growth. If you’re ready to move beyond guesswork and get a clear, data-driven picture of your marketing performance, Mr. Green Marketing, LLC can help. We start by listening to your goals and can provide a free audit to uncover exactly where your opportunities lie.
Request your free audit and performance report on Mr. Green Marketing, LLC
Leave a Comment
sing in to post your comment or sign-up if you dont have any account.